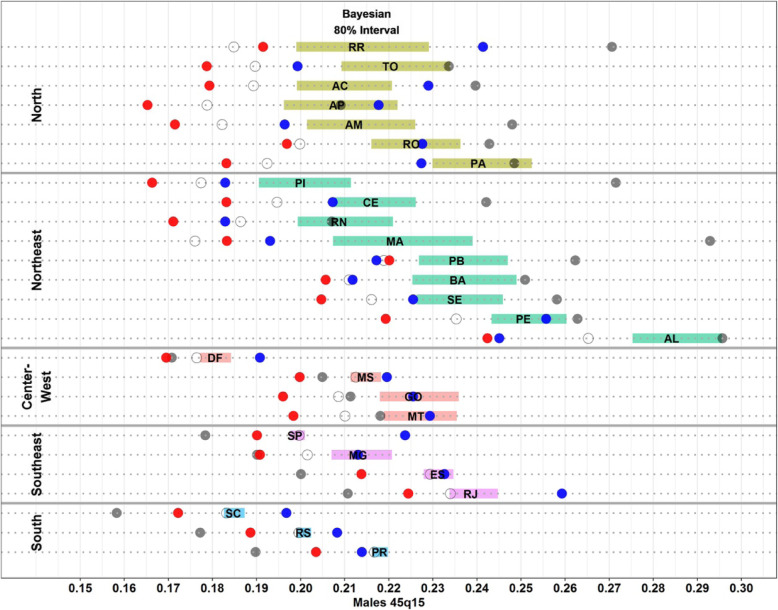
Fig. 3.
Males adult mortality probabilities (45q15), 2010—Bayesian estimate from Schmertmann and Gonzaga (2018), Queiroz et al. (2017), IHME, IBGE and MIS (Ministry of Health). Source: Schmertmann and Gonzaga [6], Queiroz et al. [9], IHME [11] and IBGE [12]. Note: Shaded bars in different colours represent 80% posterior uncertainty interval for males adult mortality probability (45q15) from Bayesian model; state abbreviations appear at posterior median for 45q15; red solid dot represent IHME estimates, grey solid dot represent IBGE estimates, blue solid dot represent Queiroz et al (2017) estimates and open circles represent unadjusted estimates from deaths registered by the Mortality Information System (MIS)

