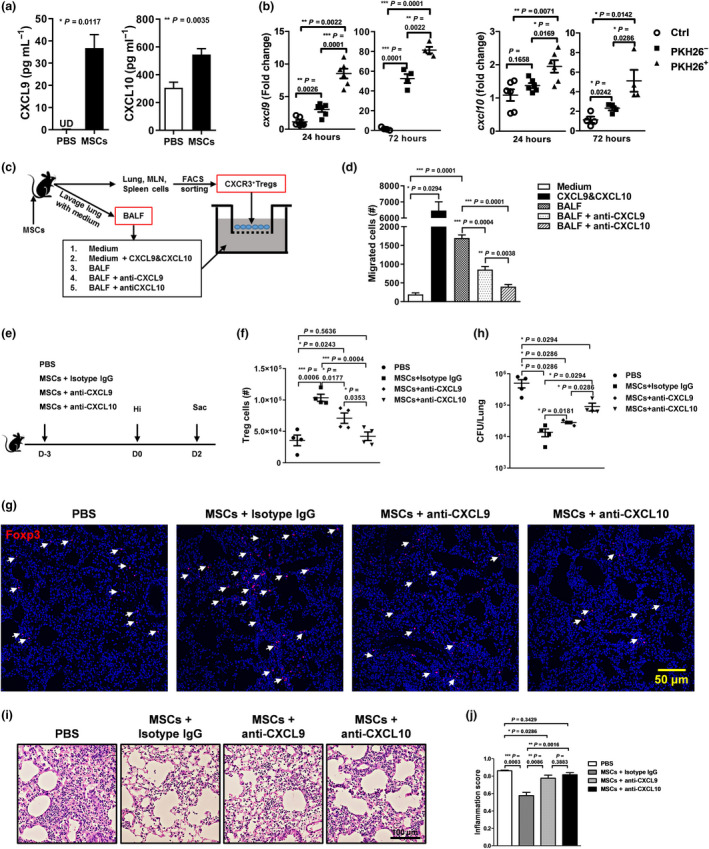
Figure 5.

MSC treatment induces production of CXCL9 and CXCL10 by lung phagocytes and recruits CXCR3+ Tregs. Lung lavage was carried out 3 days after MSC infusion. (a) Concentrations of CXCL9 and CXCL10 in the BALF were measured by ELISA. n = 5 per group. (b) PBS or PKH26‐labelled MSCs were injected into mice intravenously. After 24 and 72 hours, lungs cells were isolated and phagocytes that had engulfed MSCs (PKH28+) or not (PKH26−) were sorted by FACS, respectively. Their expression of cxcl9 and cxcl10 was determined by RT‐PCR. Phagocytes isolated from PBS‐treated lung were set as controls. n = 5 or 6 per group. (c, d) CXCR3+ T cells were collected from MSC‐treated mice. Chemotaxis of CXCR3+ T cells to CXCL9 and CXCL10 was assayed. n = 4 per group. (e) Two hours after MSC infusion, mice receiving neutralisation antibodies anti‐CXCL9 or anti‐CXCL10 or isotype antibodies via the intraperitoneal route, and then, they were infected and sacrificed 48 hours later. PBS‐treated mice were used as controls. Tregs in the lung were determined by FACS (f) and histological immunofluorescence (g). Foxp3 (red) and nuclei (blue). Arrowhead = Treg. (h) Lung bacterial loads. (i, j) Lung pathology. Representative photographs and inflammation scores were shown. n = 4 each group; UD, undetected. All the experiments were repeated three times. Representative data are shown.
