Fig. 5.
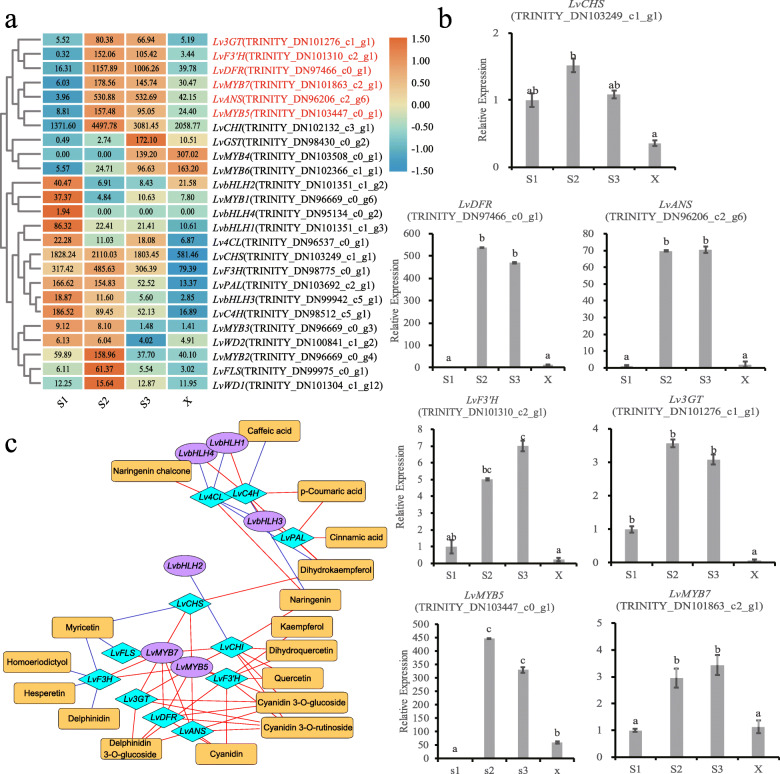
Correlation mapping between intermediate metabolites and gene expression in lily cultivar ‘Vivian’ petals. a Heatmap of functional gene expression. Each colored cell represents the average log2(FPKM) value of each pathway gene, then performed rows cluster. b Relative expression levels of genes during flower development of ‘Vivian’. Relative expression analysis of genes in bud petals (S1), coloring petals (S2), pigmented petals (S3), and un-pigmented petals (X) using the 2-ΔΔCt method. Data are means (±SD) of three biological replicates per variety. Different letters indicate statistically significant differences among the samples. c The regulatory network between secondary metabolites and related genes in the anthocyanin synthesis pathway; orange rectangular nodes represent metabolites; purple oval nodes represent TF genes; blue rhombic nodes represent structural genes; blue lines represent repression; and red lines represent activation

