
Figure 1.
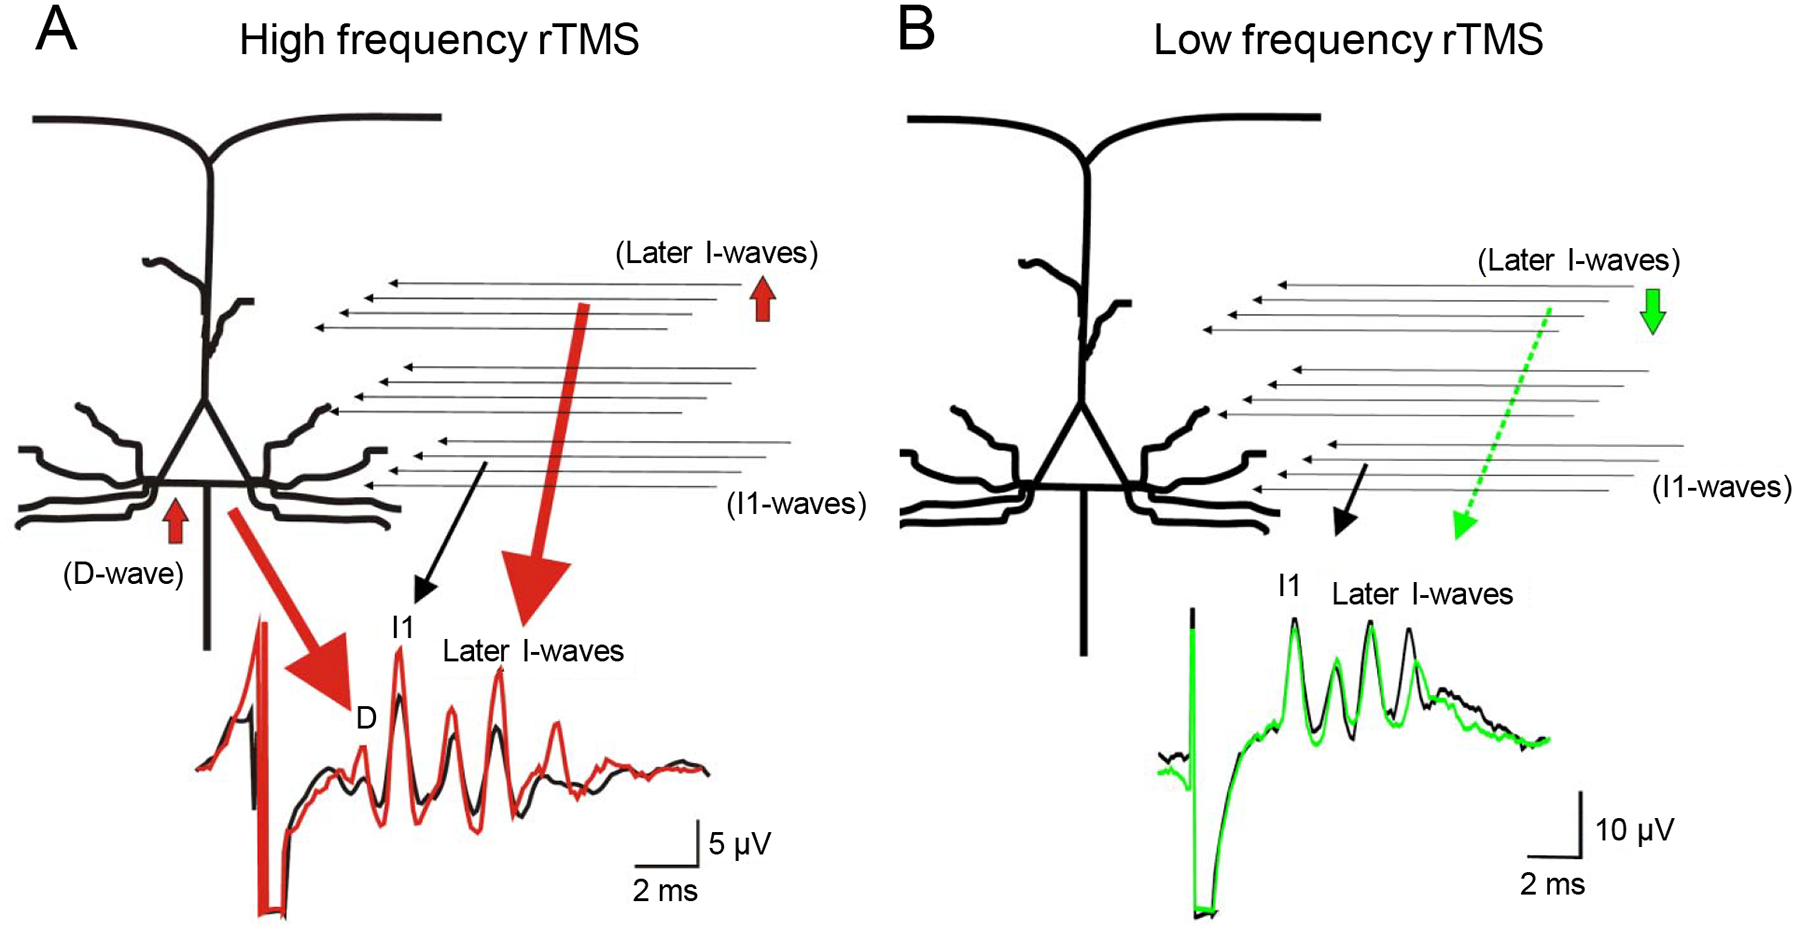
Schematic illustration of the effects of high (A) and low (B) frequencies rTMS on corticospinal descending volleys. Top diagrams represent possible sites and structures of central circuits activated by TMS. Horizontal arrows represent excitatory inputs to the corticospinal cells from excitatory interneurons. Bottom trances indicate the epidural volleys elicited by TMS before (black) and after 5 Hz (red) and 1 Hz rTMS (green), respectively. Note that after 5 Hz rTMS the amplitude of D-wave is increased, the amplitude of the I3-wave is increased and a late I4-wave appears, and that after 1 Hz rTMS the amplitude of the later I-wave is reduced. (Modified with permission from Di Lazzaro et al., 2010).36