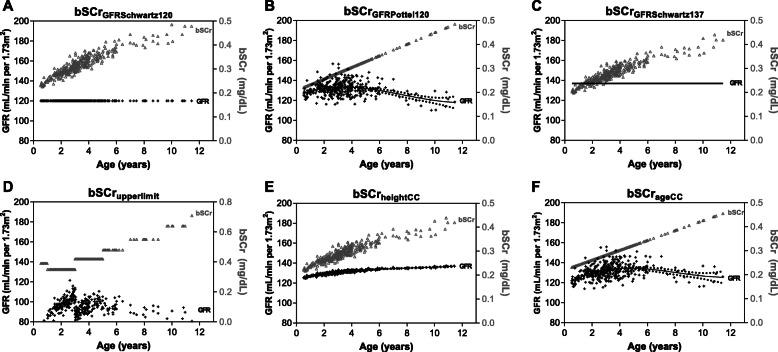
Fig. 3.
Estimated GFR and bSCr in healthy community children based on method to estimate bSCr. Graphs showing the GFR calculated off the estimated bSCr using the Bedside Schwartz equation on the left y-axis in black and the estimated bSCr in grey on the right y-axis. The top row represents approaches starting with an assumed GFR and back-calculating bSCr using either the Bedside Schwartz equation (a, c) or the Pottel height-independent equation (b). The bottom row represents approaches to estimate bSCr directly using the upper limit of normal (d) or height (e) and age (f) based estimates from community children. The eGFR for each graph was calculated using the Bedside Schwartz equation using the bSCr and height at enrollment, where eGFR = (0.413*height)/bSCr

