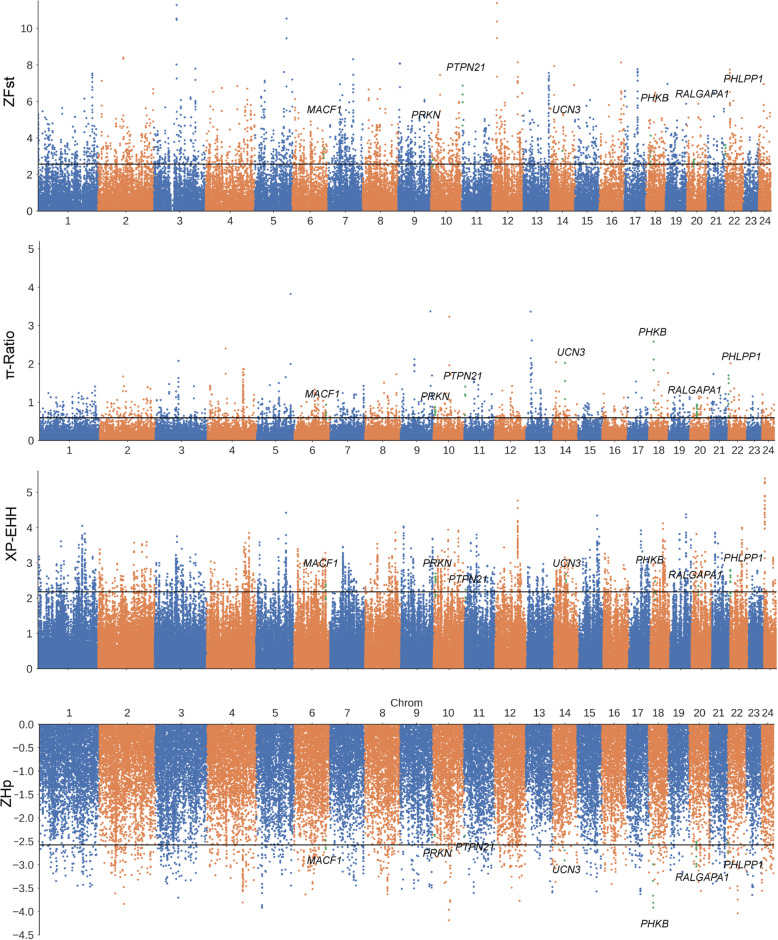
Fig. 2.
Manhattan plot of selective sweeps in Fuzhong (FZ) buffalo. ZFst, π-Ratio, XP-EHH, and ZHp values were calculated in 50-kb sliding window with 20-kb step across all autosomes in FZ buffalo. The Manhattan plots are pointed the value for each window of ZFst, π-Ratio, XP-EHH and ZHp. The black horizontal line indicates the cut-off (P-value < 0.005) setted for extracting outlier for FZ buffalo (ZFst > 2.576; π-Ratio UY/FZ > 0.592, XP-EHHFZ-to-UY > 2.180, and ZHp < − 2.576). The green dots represent the regions that contain the highlight gene

