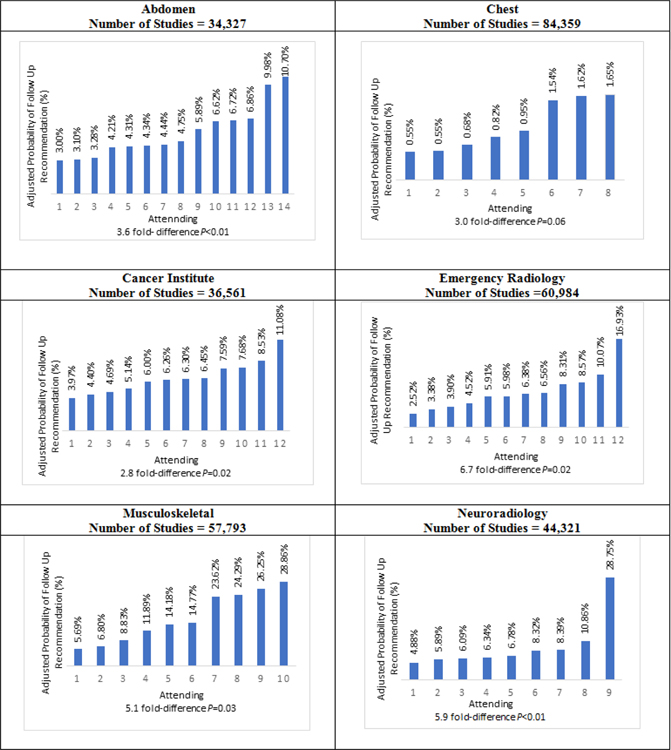
Figure 2: Follow-up Recommendation Probabilities per Attending Radiologist (n=65) in each Subspecialty Division.
Adjusted probability of a follow-up recommendation in percent (y-axis) for each radiologist in each division. P values were obtained from the division level model. Radiologists in each division are represented by a Unique Attending ID (x-axis). Figure shows the wide variation within each department, with up to a 6.7-fold difference between the radiologist with the lowest follow-up recommendation probability and the radiologist with the highest probability of making a follow-up recommendation.

