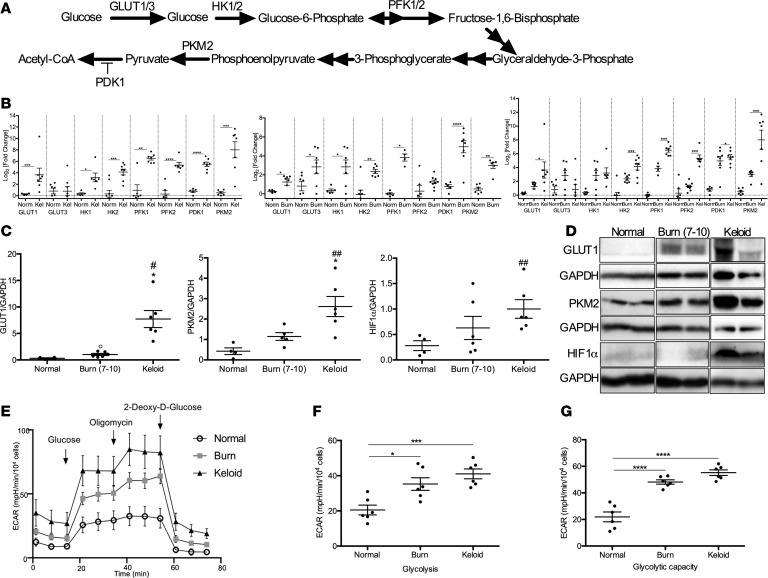
Figure 3. Altered glucose metabolism in keloid and burn tissue compared with normal skin.
(A) Schematic depicting critical glycolytic enzymes evaluated in keloid and burn tissue. (B) Gene expression studies for GLUT1, GLUT3, HK1, HK2, PFK1, PFK2, PDK1, and PKM2 in keloid tissue compared with normal skin (left), burn skin compared with normal skin (center), and all 3 tissues (right) (n = 6–8). (C) Protein expression of Glut1 (n = 4 normal skin, n = 6 burn skin, n = 6 keloid), PKM2 (n = 5 normal skin, n = 5 burn skin, n = 6 keloid), and Hif1α (n = 5 normal skin, n = 6 burn skin, n = 6 keloid). (D) Representative cropped Western blots for Glut1, PKM2, and Hif1α. (E) Seahorse XF96 glycolysis stress test performed on fibroblasts from normal skin (n = 5), burn (n = 8), and keloid (n = 6) tissues. (F and G) Measurements of glycolysis (F) and glycolytic capacity (G) were made possible using the Seahorse XF stress test reporter generator. Values are expressed as log2 (fold change) relative to normal skin, presented as mean ± SEM. Experiments were conducted twice. Student’s t test and 1-way ANOVA; *P < 0.05, **P < 0.01, ***P < 0.001, and ****P < 0.0001 keloid versus burn; #P < 0.05 and ##P < 0.01 keloid versus normal; °P < 0.05 burn versus normal.

