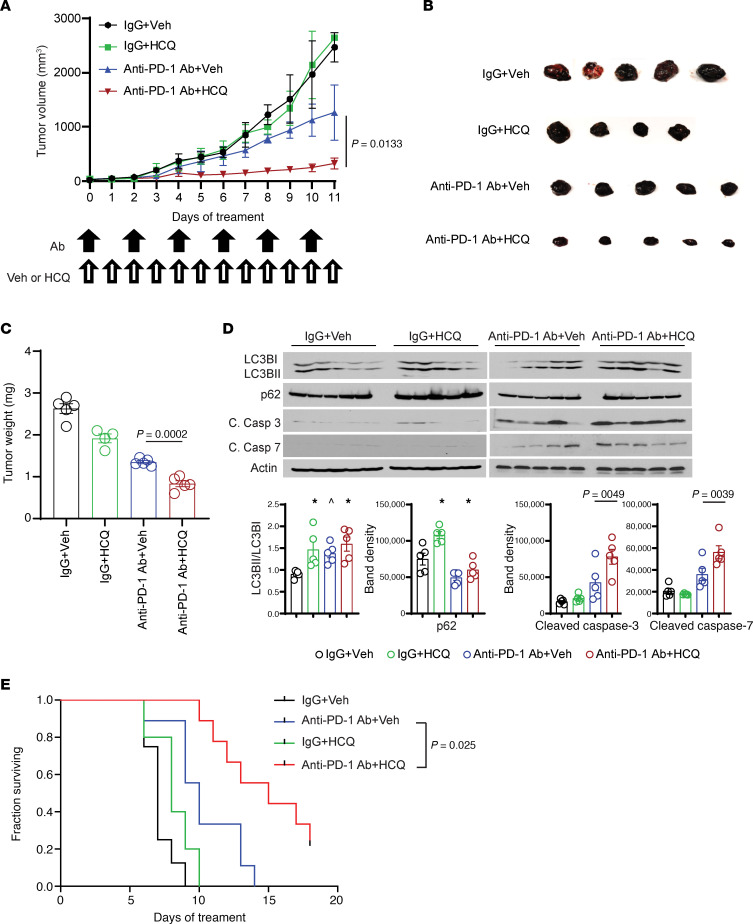
Figure 1. PPT1 inhibitor HCQ enhanced the antitumor efficacy of anti–PD-1 Ab in a mouse melanoma model.
(A) Tumor growth curve: 5 × 10⁵ B16 cells were injected in the flank of C57BL6/J mice. After tumors reached the size of 50 mm3, mice were randomized to cohorts of n = 5 mice each. Mice were treated with either IgG control 200 μg or anti–PD-1 Ab 200 μg every other day and either water or HCQ 60 mg/kg i.p. every day, and tumors were measured every day. (B) Picture of excised B16 tumors. (C) Final tumor weight. (D) Immunoblot analysis of autophagy (LC3B-I/II, SQSTM1/p62) and apoptosis markers (caspase-3 and caspase-7) with quantification of the bands. One-way ANOVA and Dunnett’s procedure. (E) Kaplan-Meier survival curve of mice treated as above in a new experiment. Exact log-rank test. The average with SEM was calculated for each treatment cohort. A P value is presented for the 2-tailed t test of the hypothesis that the addition of HCQ to anti–PD-1 Ab is significantly different compared with anti–PD-1 Ab + Veh; * indicates adjusted P < 0.05, and ^ indicates adjusted P < 0.10 testing the hypothesis that the mean relative risk is different from 1.

