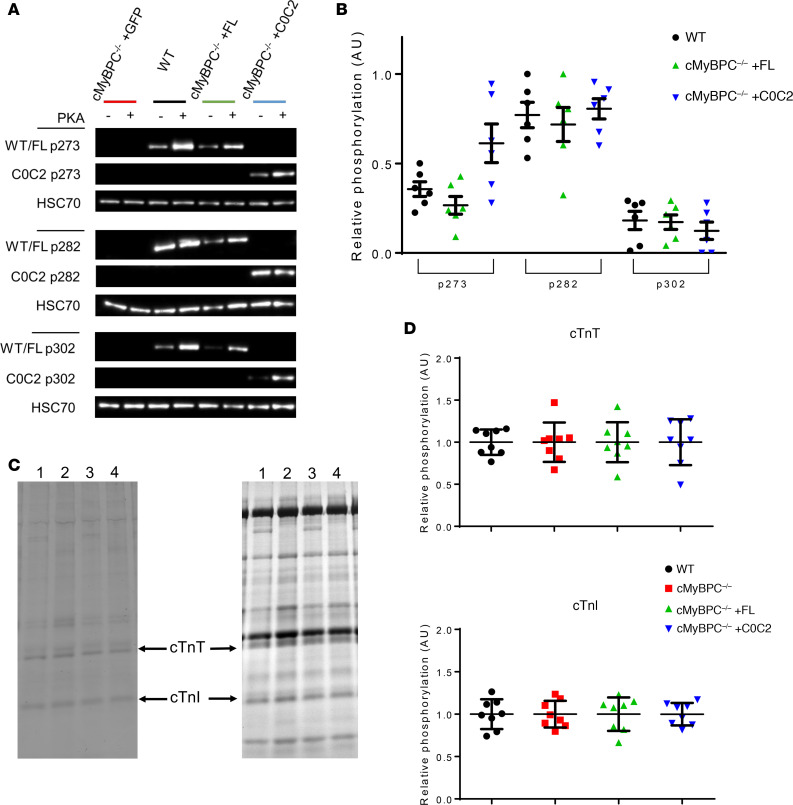
Figure 3. Phosphorylation of myofibril proteins 6 weeks after AAV9-FL and AAV9-C0C2 gene transfer.
(A) Representative Western blot of cMyBPC phosphorylation at specific phosphoserine residues (p273, p282, p302) from WT and AAV9-treated cMyBPC–/– myofibrils. (B) Quantification of relative site-specific cMyBPC phosphorylation, the signal intensities of non–PKA-treated samples were normalized to signal intensities of PKA-treated samples, and PKA-treated phosphorylation level was set as 1 (n = 6 per group). (C) Representative Pro-Q diamond–stained (left) and Coomassie-stained (right) gel image used to quantify relative phosphorylation and expression of cardiac troponin T (cTnT) and cardiac troponin I (cTnI) from WT (lane 1), AAV9-GFP–treated cMyBPC–/– (lane 2), AAV9-FL–treated cMyBPC–/– hearts (lane 3), and AAV9-C0C2–treated cMyBPC–/– hearts (lane 4). (D) Quantification of relative cTnT (top) and cTnI (bottom) phosphorylation level. The Pro-Q signal intensity of each sample was normalized to the total protein Coomassie band intensity, and WT phosphorylation level was set as 1 (n = 8 per group).

