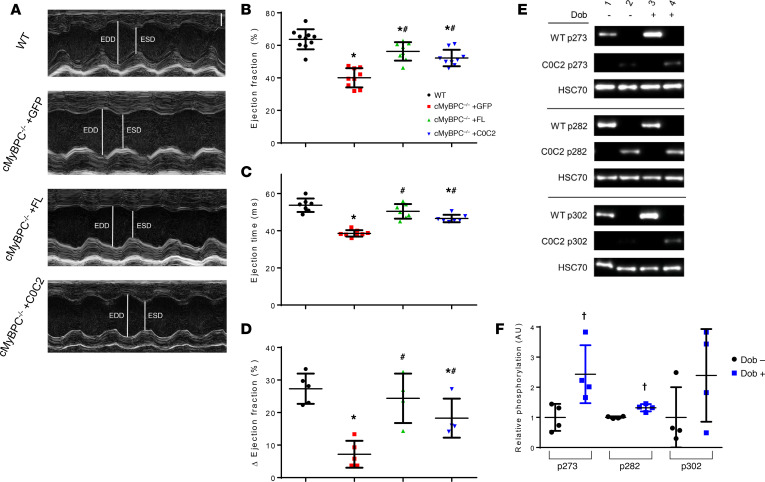
Figure 5. Effects of AAV9-FL and –C0C2 gene transfer on cMyBPC–/– in vivo cardiac function at 6 weeks.
(A) Representative 2D echocardiography images acquired in M-mode along the parasternal short-axis view. Scale bar: 1 mm. (B and C) Quantification of basal systolic ejection fraction (B) and ejection times (C) of WT and AAV9-treated cMyBPC–/– mice from 8–11 animals per group. (D) Quantification of net increase in ejection fraction after 10 mg/kg i.p. bolus dobutamine injection to assess acute β-adrenergic stress response from 4–5 animals per group. Values are expressed as mean ± SEM. Significance was determined by 1-way ANOVA with Tukey’s multiple comparisons test. *P < 0.05 versus WT group; #P < 0.05 versus cMyBPC–/– +GFP. (E) Representative Western blot showing S273, S282, and S302 phosphorylation of control (Dob–) and dobutamine infused (Dob+) WT and AAV9-C0C2–treated cMyBPC–/– hearts. (F) Quantification of relative phosphorylation of AAV9-C0C2–treated control (Dob–) and dobutamine infused (Dob+) hearts at phosphoserines 273, 282, and 302. n = 4 per group. †P < 0.05 by unpaired t test analysis.

