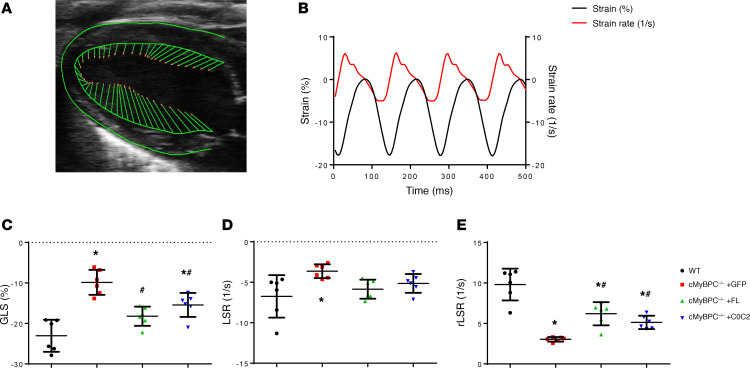
Figure 6. Speckle-tracking strain analysis of 6-week AAV9-treated mice.
(A) Representative B-mode image in parasternal long-axis view in which myocardium is traced and vector arrows of longitudinal strain along the endocardial border is displayed. (B) Representative average longitudinal strain (black) and strain rate (red) along the left ventricular myocardium. (C–E) Quantification of global longitudinal strain (GLS) (C), peak longitudinal strain rate (LSR) (D), and peak reverse longitudinal strain rate (rLSR) (E) in WT and AAV9-treated cMyBPC–/– mice, from 6 animals per group. Negative values indicate contraction; positive values indicate relaxation. Values are expressed as mean ± SEM. Significance was determined by 1-way ANOVA with Tukey’s multiple comparisons test. *P < 0.05 versus WT group; #P < 0.05 versus cMyBPC–/– + GFP.

