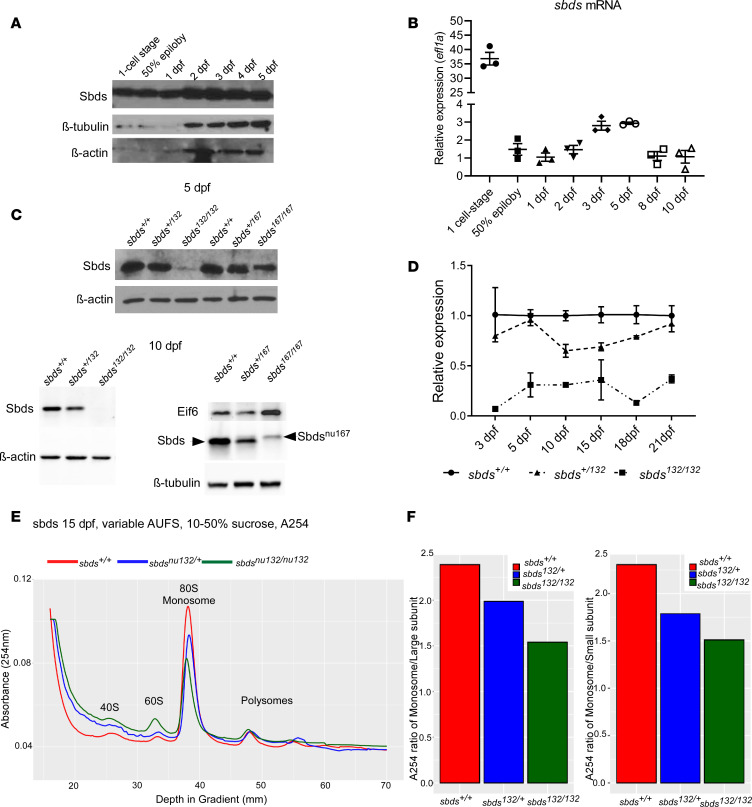
Figure 1. Sbds and sbds expression during development.
(A) Western blot of lysates from 25–30 pooled WT embryos showing Sbds expression at different stages in WT zebrafish. (B) Sbds expression profile in WT zebrafish the first 10 dpf with eifl1a as housekeeping gene. Gene expression normalized to 1 dpf and efl1a. (C) Western blotting showing Sbds expression at 5 and 10 dpf. (D) Sbds mRNA expression at different ages for WT, heterozygous, and homozygous mutants for the sbdsnu132 mutation. Expression is normalized against β-actin. (E) Polysome profile of 15 dpf larvae shows an increase of 60S and lower 80S peaks on sucrose gradient in sbds mutants and heterozygotes compared with WT siblings. (F) Ratio of monosome with respect to 40S and 60S subunits. Mutants and heterozygotes showed a lower ratio compared with WT siblings. AUFS, absorbance units full scale.

