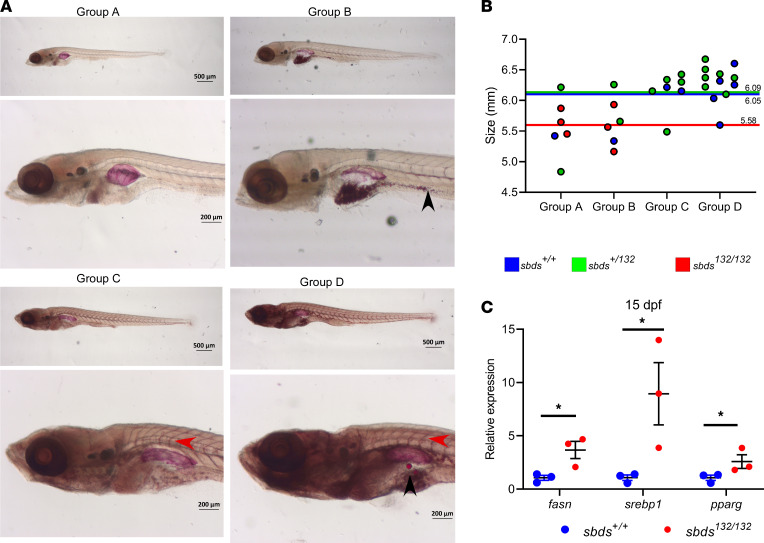
Figure 4. Sbdsnu132/nu132 mutants show a decrease in lipid accumulation.
(A) Oil Red O (ORO) staining for neutral lipid accumulation: different groups depending on ORO staining. Red arrow shows lipid accumulation in the blood vessels; lipid droplets are indicated by a black arrow. (B) Size distribution and genotypes depending on the ORO staining. Colored lines show the mean SL for each group. (C) Gene expression of lipid metabolism markers in 15 dpf larvae. Statistical analysis was performed using the t test. *P < 0.05.

