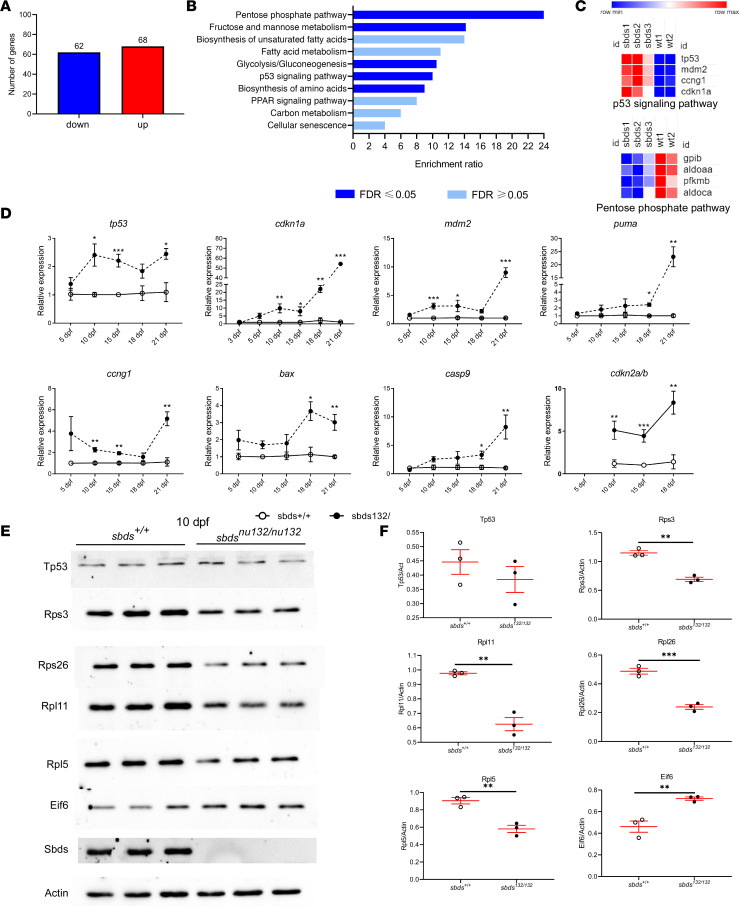
Figure 5. Transcriptional analysis identifies the upregulation of Tp53-associated genes, whereas Western blotting demonstrates a decrease in ribosomal proteins.
RNA-Seq results. (A) Bioinformatic analysis of differentially expressed genes. (B) Gene enrichment analysis. (C) Heatmap of selected genes in Tp53 and pentose phosphate pathways. Relative expression based on fragments per kilobase of transcript per million mapped reads (FPKM) values significantly different between sbds mutants and WT. The color scale at the bottom represents the expression level, where red, blue, and white colors indicate upregulation, downregulation, and unaltered expression, respectively, on FPKM values. RT-qPCR analysis (D) mRNA levels at different time points of genes related to Tp53 pathway. (E) Western blotting at 10 dpf, 3 biological replicates for sbds+/+ and sbdsnu132/nu132. Two independent experiments with N = 3 each. (F) Quantification of Western blots using ImageJ (NIH). Statistical analysis was performed using the t test. *P < 0.05, **P < 0.001, ***P < 0.0001.

