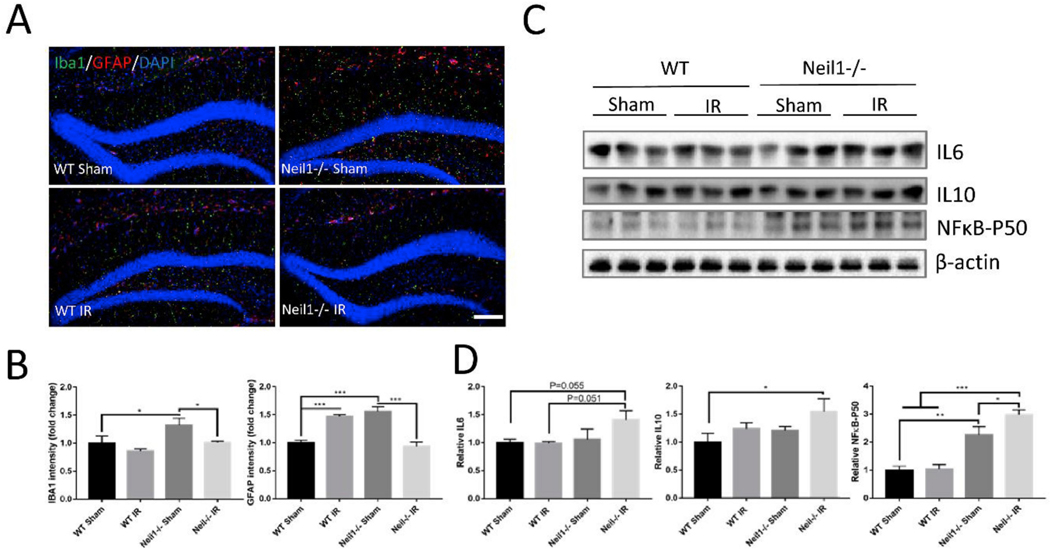
Fig. 3.
Neil1−/− mice exhibit increased inflammation response after IR exposure. Representative images of IBA1 (green) and GFAP (red)staining of hippocampi from WT and Neil1−/− mice with or without IR exposure(A). Scalebar means 100 μm. Quantification of IBA1 and GFAP signal intensity (B) from sections was measured. n = 4 mice per group. Quantifications are presented as mean ± SEM. Representative immunoblots of cytokine IL6, IL10 and NFκB-P50 protein from the hippocampi of WT or Neil1−/− mice after 20 h of IR exposure (C). Quantification of IL6, IL10 and NFκB-P50 protein intensity (D). n = 3 mice per group. Data shown are mean ± SEM. *P < 0.05, **P < 0.01, ***P < 0.001. (For interpretation of the references to color in this figure legend, the reader is referred to the Web version of this article.)

