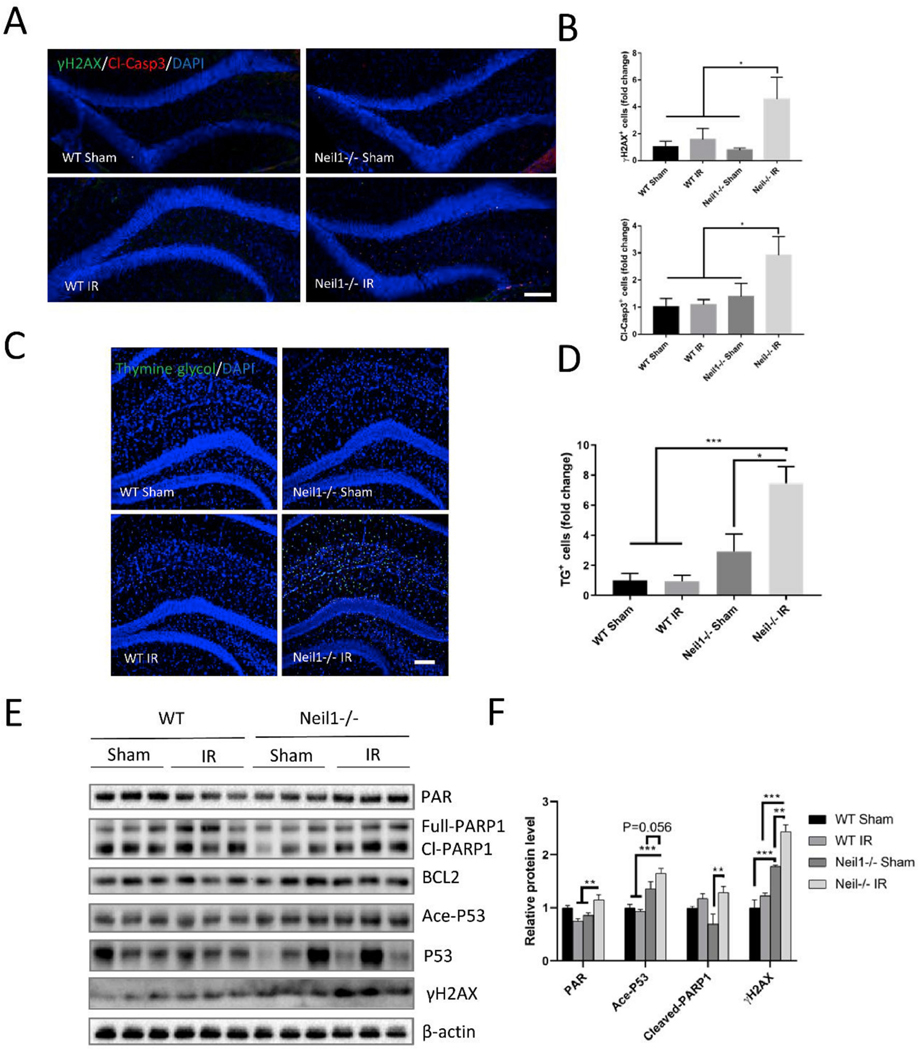
Fig. 5.
DNA damage and apoptosis are increased in Neil1−/− after 20 h of IR exposure. Representative images of γ-H2AX (green), cleaved-caspase 3 (red), and DAPI (blue) staining of dentate gyrus sections from WT, Neil1−/− mice treated with or without IR (A). Scalebar means 100 μm. Quantification of γH2AX + cells and cleaved-caspase3+ cells in dentate gyrus of hippocampus (B). n = 4 mice per group. Representative images of thymine glycol positive cells (TG+, green), and DAPI (blue) staining of hippocampus sections from WT and Neil1−/− mice treated with or without IR (C). Scalebar is 100 μm. Quantification of TG + cells in hippocampus (D). Representative immunoblots of the indicated proteins from the hippocampus of WT, and Neil1−/− after 20 h of IR exposure (E). Quantification of immunoblots from Fig. 4C of the PAR, Ace-P53, Cleaved-PARP1, and γ-H2AX protein levels (F). Relative proteins were normalized with β-actin. n = 3 mice per group. Data shown are mean ± SEM. *P < 0.05, **P < 0.01, ***P < 0.001. (For interpretation of the references to color in this figure legend, the reader is referred to the Web version of this article.)

