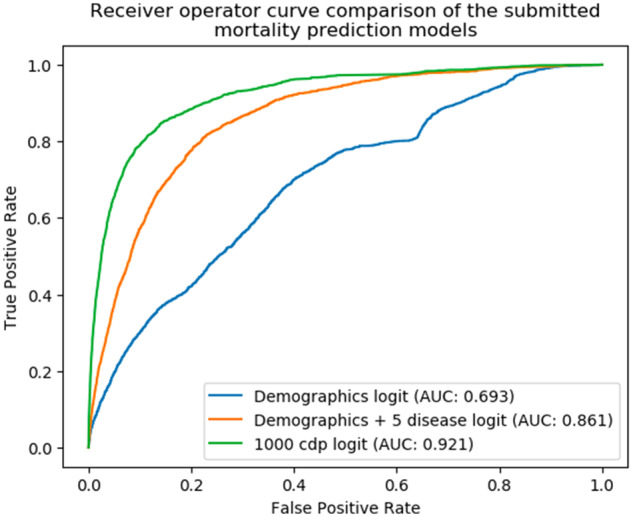
Figure 4.

A comparison of the receiver-operating characteristic curves for the 3 mortality prediction models submitted, trained, and evaluated using the “Model to Data” framework. AUC: area under the curve; cdp: condition/procedure/drug.

A comparison of the receiver-operating characteristic curves for the 3 mortality prediction models submitted, trained, and evaluated using the “Model to Data” framework. AUC: area under the curve; cdp: condition/procedure/drug.