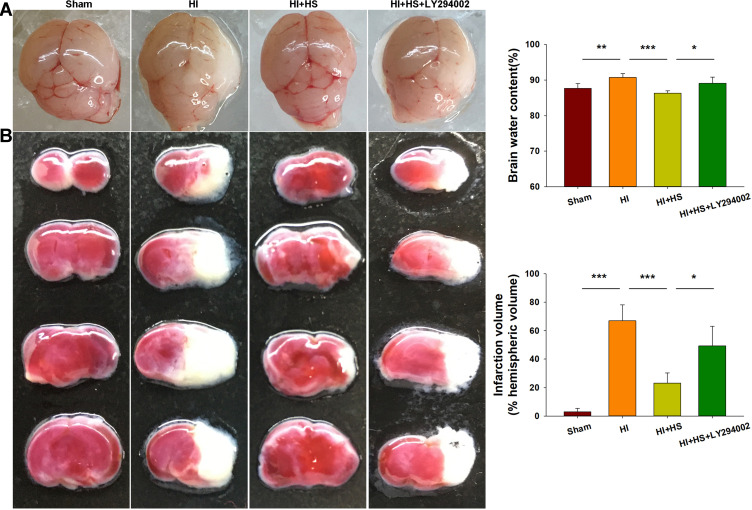
Figure 2.
HS attenuates edema and infarct volume via the Akt pathway. (A) Representative images of brain edema at 3 days post-HI. Brain water contents within the ipsilateral hemispheres were determined using both dry and wet methods. N=5/group. (B) Brain slices were stained with TTC for quantification of infarct volumes. N=4/group. Values represent the mean ± SD, *p < 0.05, **p < 0.01, ***p < 0.001 according to ANOVA.

