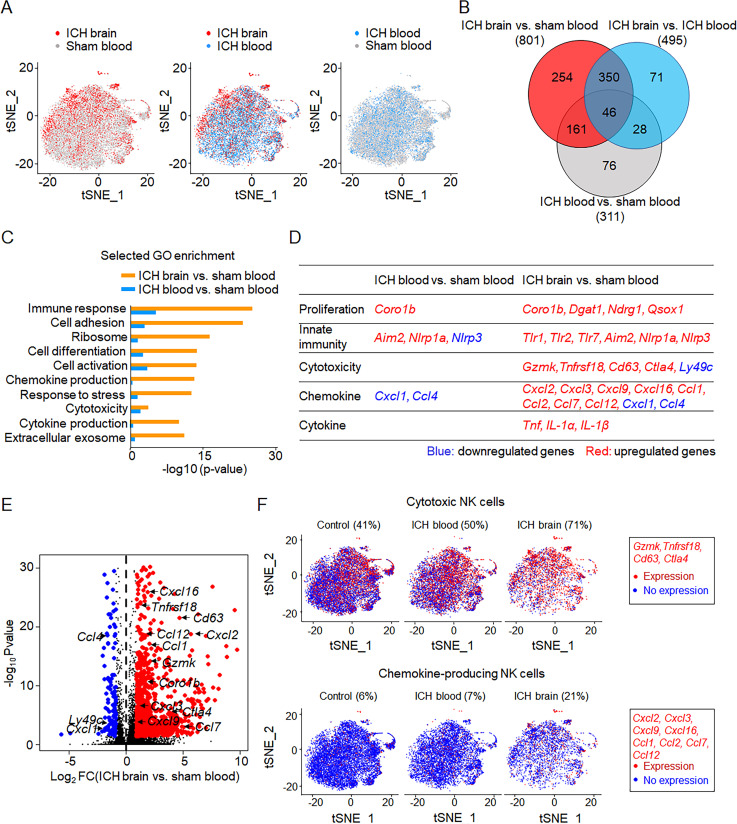
Figure 3.
Brain alters transcriptome profiles of infiltrating NK cells after ICH. ICH was induced by autologous blood injection in C57BL/6 mice. Sham mice were used as controls. 12 h after ICH, NK cells were isolated from blood and brain tissues. The diversity of NK cells was assessed by single-cell RNA-seq on individual cells isolated from blood and brain. (A) t-SNE plots of NK cells obtained from ICH brain (n = 4,065 cells), ICH blood (n = 8,506 cells), and sham blood (control, n = 12,070 cells). NK cells were defined as CD45+CD3−NK1.1+NKp46+CD200R1−CD49a−. Data are from two independently repeated experiments. (B) Venn diagram of the DEGs between NK cells from ICH brain, ICH blood, and sham blood. The numbers indicate the unique and common DEGs in different comparisons. Data are from two independently repeated experiments. (C) Selected gene ontology enrichment of genes expressed in NK cells obtained from ICH brain and ICH blood versus NK cells from sham blood. Data are from two independently repeated experiments. (D) DEGs encoding cell proliferation, cytotoxicity, chemokine production, and cytokine production in NK cells from ICH brain and ICH blood versus NK cells from sham blood. Data are from two independently repeated experiments. (E) Volcano plot showing the fold change of genes (log2 scale) of NK cells in ICH brain compared with NK cells in sham blood (x axis) and their significance (y axis, −log10P value). Highly significant genes are indicated by a red dot (up-regulated) or blue dot (down-regulated), and genes related to cytotoxicity and chemokines are labeled on the plot. Data are from two independently repeated experiments. (F) t-SNE plots show brain-infiltrating NK cells with higher cytotoxicity or increased chemokine production after ICH versus NK cells from ICH blood or sham blood. Cytotoxicity or chemokine genes expressed by NK cells are in red. Data are from two independently repeated experiments.

