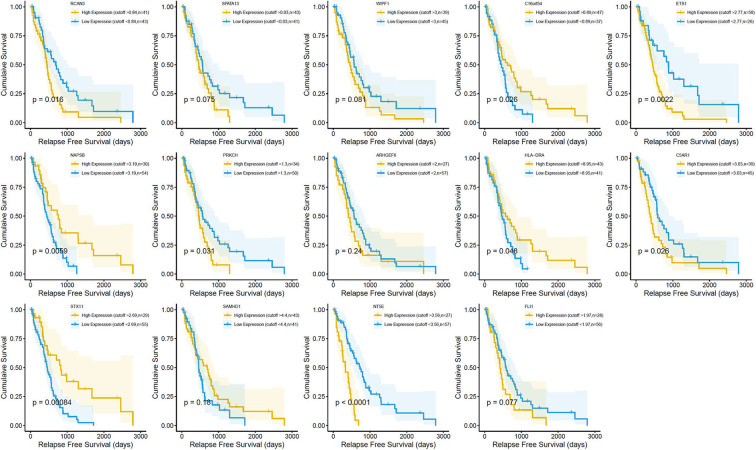
Figure 5.
Correlation between the expression of 14 individual differentially expressed genes (DEGs) and the relapse-free survival (in days) in The Cancer Genome Atlas (TCGA) dataset. Kaplan–Meier survival curves were generated for the selected DEGs extracted from the comparison of high (yellow line) and low (blue line) gene expression groups. p < 0.05 in log-rank test. RFS, relapse-free survival in days.

