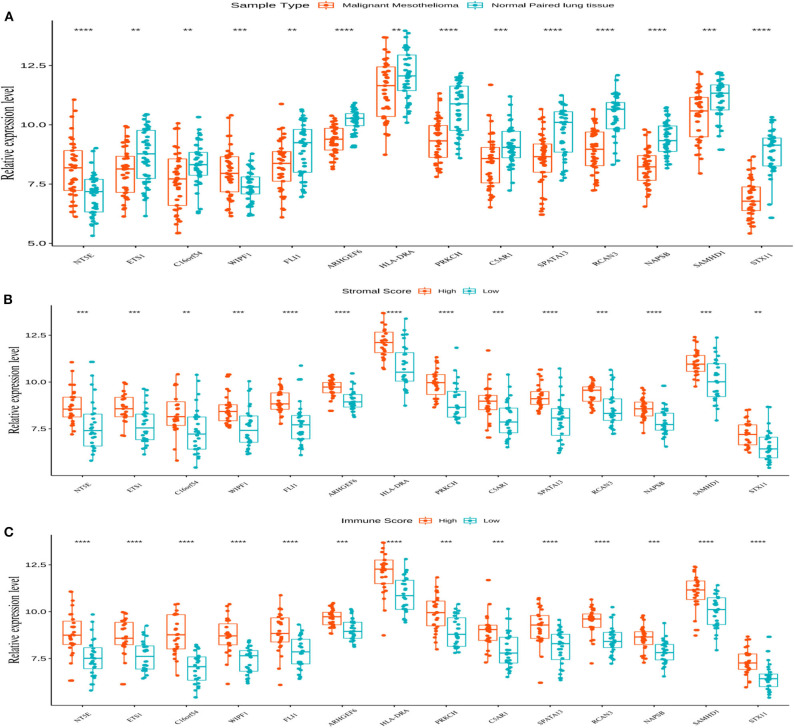
Figure 6.
The expression of 14 genes and their relationship with the stromal and immune scores. (A) All 14 genes showed abnormal expression on comparing the malignant mesothelioma tissue with the normal paired lung tissue in the Gene Expression Omnibus (GEO) database. The box plot is used to show the relationship between the abnormal expression of the 14 genes and the stromal/immune scores (B,C). **p < 0.01, ***p < 0.001, and ****p < 0.0001.

