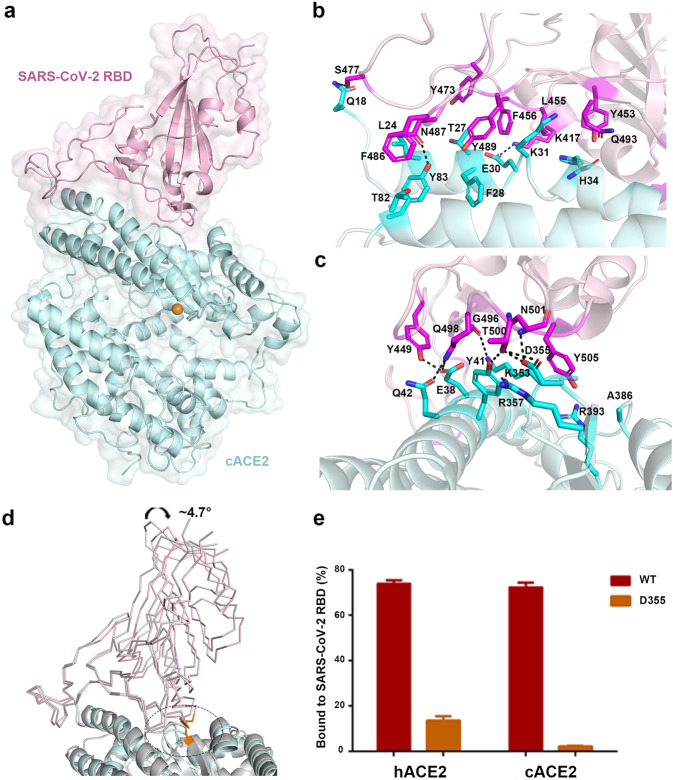
Fig. 4. The complex structure between cACE2 and SARS-CoV-2 RBD.
a The overall complex structure of cACE2 bound to SARS-CoV-2 RBD. cACE2 and SARS-CoV-2 RBD were colored in lightpink and palecyan, respectively. b, c The detailed interaction between cACE2 and the SARS-CoV-2 RBD. The residues involved in the interaction were labeled, and H-bonds were shown as dotted lines with a cutoff of 3.3 Å. d The overall comparison between the complex of cACE2 and SARS-CoV-2 RBD and that of hACE2 and SARS-CoV-2 RBD. hACE2 and SARS-CoV-2 RBD complex were colored in gray. SARS-CoV-2 RBDs and ACE2s were displayed in ribbon and cartoon, respectively. Residue D355 of ACE2 and interacted residues on SARS-CoV-2 RBD were circled, related to Supplementary Fig. S2c, d. e HEK293T cells transfected with pEGFP-N1-cACE2, hACE2 (WT), or the mutants containing D355A were incubated with His-tagged SARS-CoV-2 RBD protein. Anti-His/APC antibody was used to detect the His-tagged protein binding to the cells by flow cytometry. The percentage of the indicated ACE2-expressing cells that were bound to SARS-CoV-2 RBD were shown as a histogram. The assays were independently performed twice. One representative data was displayed with the mean of triplicates (n = 3), and the bar represented the SD value.

