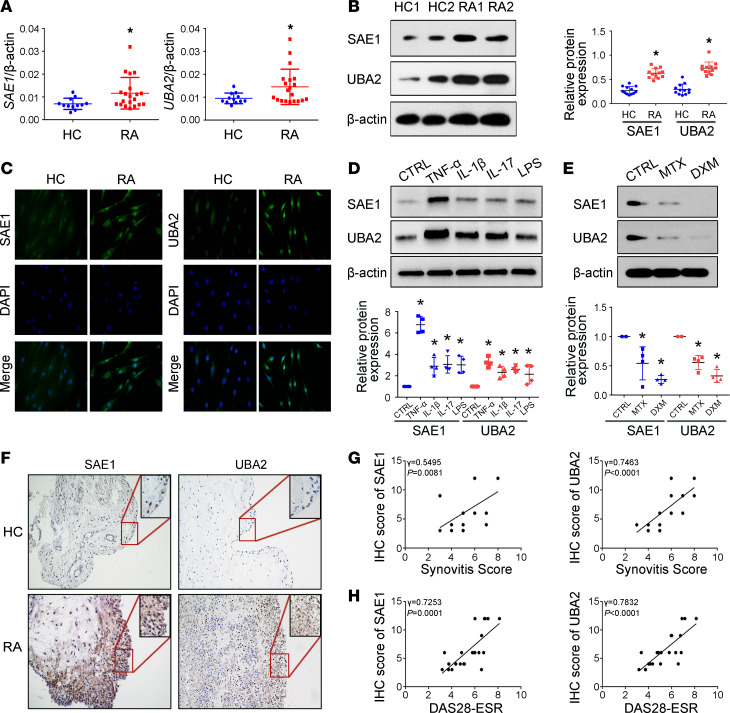
Figure 1. Elevated expression of SAE1 and UBA2 in FLSs and synovial tissues from patients with RA.
(A) mRNA expression of SAE1 and UBA2 was evaluated as demonstrated by quantitative real-time PCR (RT-qPCR) in FLSs from patients with RA (n = 20) and HCs (n = 12). (B) Protein expression of SAE1 and UBA2 in FLSs was evaluated by Western blot analysis. Data are expressed as the mean ± SD of densitometry quantification (right panel) from 12 RA patients and HC subjects. (C) For cellular immunofluorescence (IF) staining, SAE1 or UBA2 (shown in green) and nuclei (shown in blue) were evaluated using fluorescence microscopy, and representative images from 6 RA patients and 6 HC subjects are shown. Original magnification, ×400. (D) RA FLSs were treated with TNF-α (10 ng/mL), IL-1β (10 ng/mL), IL-17 (10 ng/mL), or LPS (100 ng/mL) for 24 hours. Data show the mean ± SD of samples from 4 patients with RA. (E) RA FLSs were treated with methotrexate (10 μg/mL) or dexamethasone (1 μg/mL) for 24 hours. Data show the mean ± SD of samples from 4 patients with RA. (F) Expression of SAE1 and UBA2 assessed by immunohistochemistry in STs from RA patients and HC subjects. The representative images from 22 RA patients and 5 HC subjects are shown. Original magnification, ×200; insets, ×400. (G and H) Correlation of synovial SAE1/UBA2 protein expression with the synovitis score (G) and DAS28-ESR (H) in patients with RA. The expression of SAE1 and UBA2 proteins and the synovitis score of 22 patients with RA were evaluated by immunohistochemistry and H&E staining, respectively. Correlation analysis was performed by Spearman’s rank order correlation test. *P < 0.05 versus HC or CTRL, by Student’s t test (for A and B) or 1-way ANOVA (for D and E).

