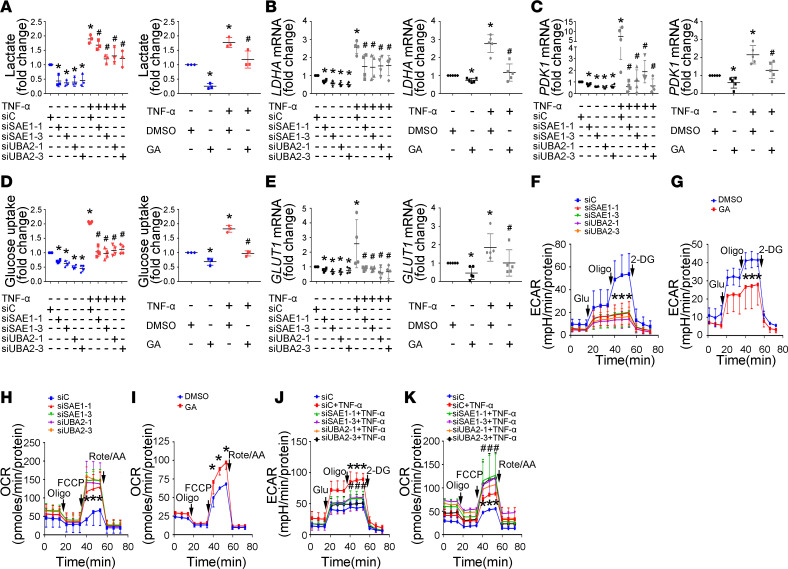
Figure 3. Effect of SAE1/UBA2-mediated SUMOylation inhibition on glycolytic metabolism in RA FLSs.
RA FLSs were transfected with siRNA-1 and siRNA-3 for SAE1 (siSAE1-1, siSAE1-3) or UBA2 (siUBA2-1, siUBA2-3) or control siRNA (siC) for 48 hours or pretreated with GA (150 μM) for 24 hours and then stimulated with or without TNF-α (10 ng/mL) for 24 hours. (A) Effect of SAE1/UBA2 inhibition on lactate secretion. Lactate levels in the supernatants of cultured RA FLSs were detected using a Lactate Colorimetric Assay Kit. Data show the mean ± SD of samples from 3 patients with RA. (B and C) Effect of SAE1/UBA2 inhibition on the expression of lactate dehydrogenase A (LDHA) and pyruvate dehydrogenase kinase 1 (PDK1). The expression of LDHA and PDK1 was measured by RT-qPCR. Data show the mean ± SD of samples from at least 4 patients with RA. (D and E) Effect of SAE1/UBA2 inhibition on glucose uptake and GLUT1 expression. Glucose uptake (D) was detected using a colorimetric glucose uptake assay kit. Data show the mean ± SD of samples from at least 3 patients with RA. GLUT1 expression (E) was measured by RT-qPCR. Data show the mean ± SD of samples from at least 4 patients with RA. (F–K) Effect of SAE1/UBA2 knockdown and GA treatment on the extracellular acidification rate (ECAR, F, G, and J) and oxygen consumption rate (OCR, H, I, and K). The data are representative of at least 3 independent experiments (mean ± SD). *P < 0.05 versus siC or DMSO; #P < 0.05 versus TNF-α+siC or TNF-α+DMSO, by Student’s t test (for G and I) or 1-way ANOVA (for other panels).

