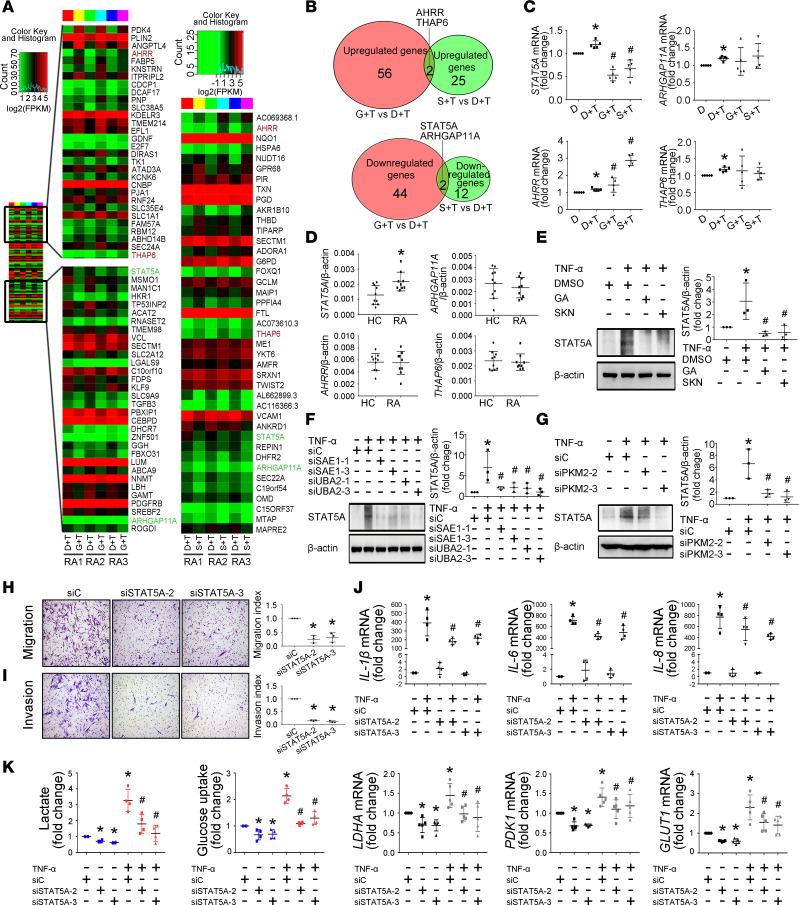
Figure 5. STAT5A mediates SUMOylated PKM2-induced glycolysis and biological functions of RA FLSs.
(A) Heatmap with hierarchical clustering of differently expressed genes (P < 0.05) by RNA sequencing in GA-treated (G+T) or SKN-treated (S+T) versus DMSO-treated (D+T) RA FLSs from 3 patients. (B) Venn diagrams showing number of shared and distinct GA- or SKN-treated genes by RNA sequencing in RA FLSs. (C) Expression of STAT5A, AHRR, THAP6, and ARHGAP11A was validated by RT-qPCR. Ct values were normalized to β-actin. Data are presented as the mean ± SD of samples from 5 patients with RA. (D) Expression of STAT5A, AHRR, THAP6, and ARHGAP11A in RA FLSs and HC FLSs measured by RT-qPCR. Data show the mean ± SD of samples from 9 patients with RA and 10 HCs. (E–G) Effect of treatment with GA or SKN (E), SAE1/UBA2 knockdown, or PKM2 knockdown (F and G) on TNF-α–induced STAT5A expression measured by Western blot. Data show the mean ± SD of samples from 3 patients with RA. (H and I) Effect of STAT5A knockdown on migration and invasion of RA FLSs. RA FLSs were transfected with siRNAs for STAT5A (siSTAT5A-2, siSTAT5A-3) or siC. Migration (H) and invasion (I) were measured with a Boyden chamber. The migrated or invaded FLSs were stained violet using a Diff-Quik kit (left; original magnification, ×100). Data show the mean ± SD of samples from 3 patients with RA. (J) Effect of STAT5A knockdown on expression of IL-1β, IL-6, and IL-8. Cytokine expression was measured by RT-qPCR. Data show the mean ± SD of samples from 4 patients with RA. (K) Effect of STAT5A knockdown on lactate secretion, glucose uptake, and expression of LDHA, PDK1, and GLUT1. The data represent at least 4 independent experiments (mean ± SD). *P < 0.05 vs. siC or DMSO or HC; #P < 0.05 vs. TNF-α + siC or TNF-α + DMSO, Student’s t test (D) or 1-way ANOVA (other panels).

