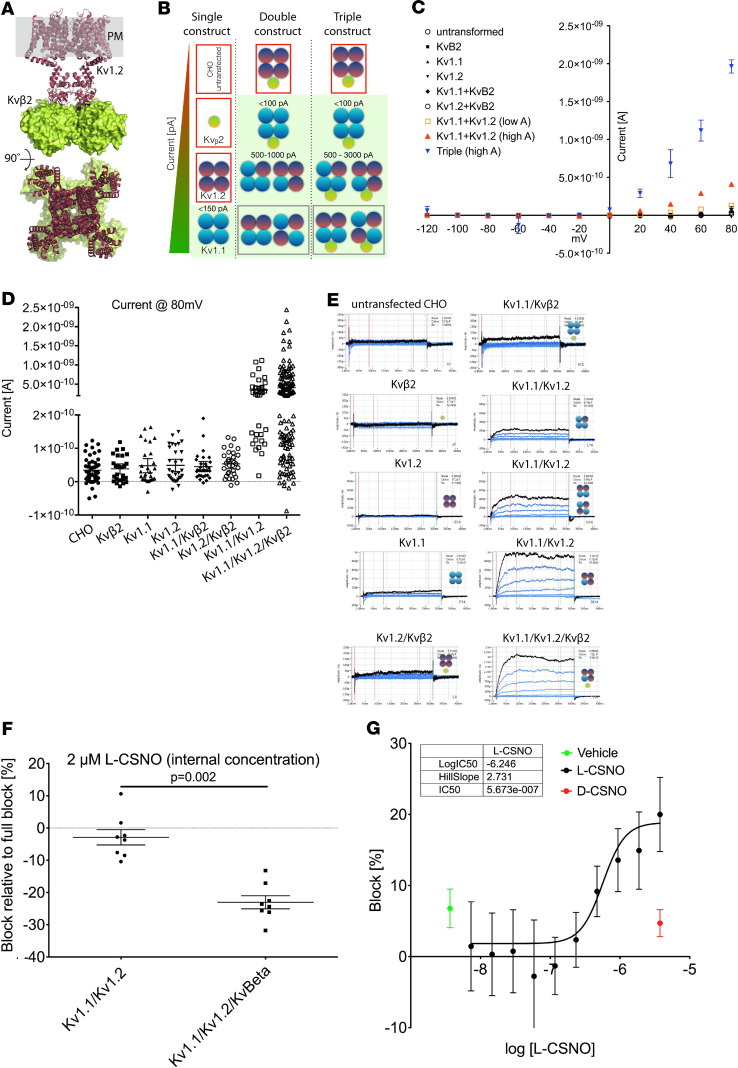
Figure 2. SyncroPatch analysis of the Shaker channel constructs.
(A) Kv1.2/Kvβ2 crystal structure (PDB 2A79). The homotetramer of Kv1.2 is in the brown ribbon; Kvβ2 is the green surface; the plasma membrane (PM) is gray. (B) Schematic drawing of the individual cell lines after transfection with Kv1.1, Kv1.2, and Kvβ2. Not all cells will express all proteins; this schematic shows all permutations, with the corresponding experimental patch clamp results. Icons surrounded by red boxes show no conductance, while icons with a light green background show specific K+ channel activity. Gray boxes indicate possible conformations that cannot be distinguished based on conductance. (C) Conductance characteristics of the different cells lines upon voltage gate clamping from –120 mV to +80 mV (n = 204 single-cell patch clamp studies, with 20 untransformed, 20 Kvβ2 alone, 26 Kv1.1 alone, 28 Kv1.2 alone, 28 Kv1.1/Kvβ2, 25 Kv1.2/Kvβ2, 27 Kv1.1/Kv1.2, and 61 triple-expressing). Current at each voltage above 20 mV is greater for the triple-overexpressing than for the other cells.) (D) Conductance of each cell line at +80 mV resting potential. Note that only Kv1.1/Kv1.2 and Kv1.1/Kv1.2/Kvβ2 show currents >500 pA. n is the same as described in C. (E) Examples of individual traces, showing 11 sweeps corresponding to the ramping protocol for different cells. Black is +80 mV. All traces are on the same scale. (F) Effect of L-SNOC on K+ current block in either the double or triple cell line. n = 8 cells in each condition; P = 0.002 by Mann-Whitney rank-sum test t test. (G) IC50 determination of L-CSNO on triple cell line with currents >500 pA represented as % block (error bars represent a confidence level of 95% [CL 95]) compared with TEA full block. There is no block with either vehicle (green) or D-CSNO (red). n = 8 in the L-CSNO group and n = 8 in the D-CSNO group. At concentrations greater than 500 nM (n = 236 points analyzed), inhibition by L-CSNO is greater than inhibition by D-CSNO (P = 0.0001 vs. D-CSNO and P = 0.0048 vs. vehicle, by Kruskal-Wallis test). Data are presented as median ± 95% CI.

