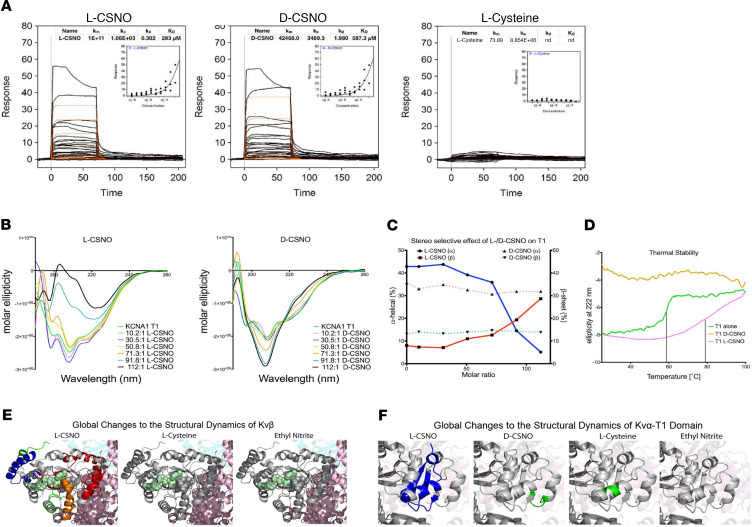
Figure 3. L-CSNO binding to Kv proteins.
L-CSNO has unique binding interactions with the intracellular Kv proteins Kv1.1α T1 (A–E) and Kvβ2 (F) (see also Supplemental Figure 3). (A) The SPR binding response of L-CSNO, D-CSNO, or l-cysteine to Kv1.1α T1. The binding isotherm for each protein-ligand interaction is represented in the inset of each graph. n = 25 measurements each. Data are mean ± SEM.(B) CD analysis of Kv1.1α T1 in the presence of increasing amounts of L-CSNO and D-CSNO. n = 7 measurements each. (C) Secondary structure changes of Kv1.1α T1 upon titration with L-CSNO or D-CSNO. (D) Substrate stereoselectivity and thermal stability of Kv1.1α T1. Melting temperature increases by 20°C upon L-CSNO binding to Kv1.1α T1. km, Michaelis constant; ka, association constant; kd, dissociation constant; KD, affinity. (E) Differential deuterium uptake after a 15 minute pulse between the unliganded Kvβ and in solution with L-CSNO, D-CSNO, l-cysteine, or EtONO. Blue peptides represent a greater than 20% rigidification; green peptides represent between 0% and 20% rigidification. (F) Differential deuterium uptake after a 1 minute pulse between the unliganded Kv1.1α T1 and in solution with L-CSNO, D-CSNO, or l-cysteine. Blue peptides represent a greater than 20% rigidification. Green peptides represent between 0% and 20% rigidification, and gray peptides represent no significant rigidification. NADPH is shown in teal spheres.

