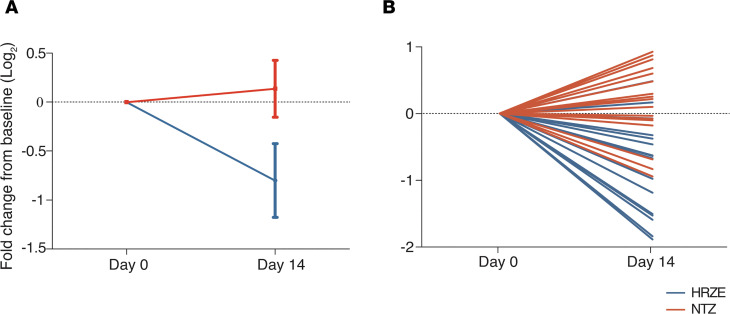
Figure 6. Change in urinary DiAcSpm levels in GHESKIO cohort confirmed using ELISA.
(A) ELISA-measured urinary DiAcSpm levels demonstrate significant concentration decreases in participants treated with HRZE (n = 16, in blue) over 14 days, but not in those treated with NTZ (n = 19, in red). Solid dots represent mean fold change from baseline levels in log2 scale. Error bars represent 90% CI and do not overlap at day 14. (B) Changes in ELISA-measured urinary DiAcSpm levels of individual participants over 14 days. Each line represents a single participant. Dotted line in each graph represents no change from baseline. All values have been normalized to corresponding urinary creatinine concentration.

