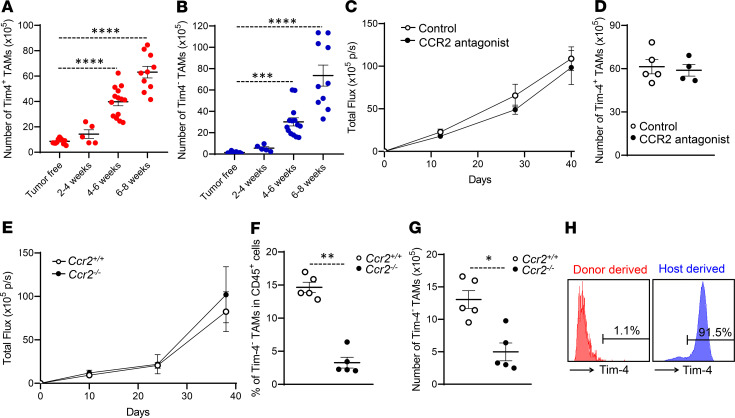
Figure 2. Tim-4– TAMs migrate from peripheral monocytes without affecting tumor growth.
(A and B) Dynamic changes of Tim-4+ (A) and Tim-4– (B) TAM numbers during peritoneal ovarian cancer progression (n = 5 to 14 mice/group, mean ± SEM). ***P < 0.001, ****P < 0.0001 (1-way ANOVA with Dunnett’s multiple-comparisons test) between tumor-free and tumor-bearing mice at different time points. (C) Tumor growth in mice treated with CCR2 antagonist or PBS (n = 8 to 10 mice/group, mean ± SEM). (D) Tim-4+ TAM numbers in mice treated with CCR2 antagonist or PBS (n = 4 to 5 mice/group, mean ± SEM). (E) ID8 tumor growth in Ccr2+/+ and Ccr2–/– mice (n = 5 mice/group, mean ± SEM). (F and G) Effect of CCR2 deficiency on Tim-4– TAMs. Percentage (F) and number (G) of Tim-4– TAMs were compared between Ccr2+/+ and Ccr2–/– mice bearing ID8 tumors. (n = 5 mice/group, mean ± SEM). *P < 0.05, **P < 0.01 (Mann-Whitney U test). (H) Source of Tim-4+ TAMs. CD45.1+ monocytes were transferred (I.P.) into ID8 tumor–bearing CD45.2 mice. Tim-4 was determined on CD45.1+ (shown in red) and CD45.2+ (shown in blue) TAMs. One representative of 4 is shown. p/s, photons/second.

