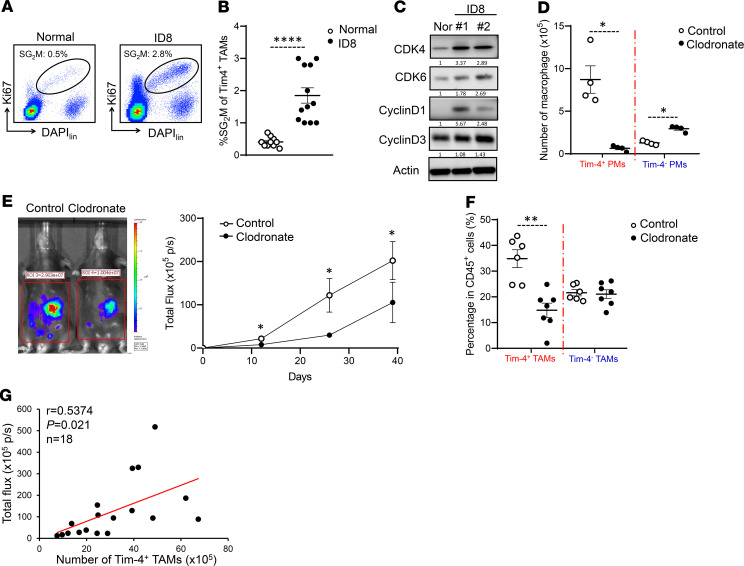
Figure 3. Tim-4+ TAMs are embryonically derived proliferative cells with protumor function.
(A and B) Proliferative status of Tim-4+ TAMs in tumor-bearing mice. (A) Flow cytometry dot plots represent the percentage of Tim-4+ macrophages in SG2M phase. (B) Percentage of SG2M-positive macrophages in Tim-4+ peritoneal macrophages from normal and ID8 tumor–bearing mice (n = 10–12 mice/group, mean ± SEM). ****P < 0.0001 (Mann-Whitney U test). (C) Western blot showing cell cycle proteins in Tim-4+ peritoneal residential macrophages and Tim-4+ TAMs. One representative of 3 is shown. (D) Effect of CLs on peritoneal macrophages (PMs). Tim-4+ and Tim-4– peritoneal macrophage numbers were quantified in tumor-free mice treated with control liposome or CL (n = 4 mice/group, mean ± SEM). *P < 0.05 (Mann-Whitney U test) between control and clodronate-treated mice in both Tim-4+ PMs and Tim-4– PMs. (E) Tumor growth between control liposome– and CL-pretreated mice (n = 6–8 mice/group, mean ± SEM). *P < 0.05 (Mann-Whitney U test) between control and clodronate-treated mice at days 12, 26, and 39. (F) Percentage of TAM subsets in total CD45+ immune cells between control and clodronate treatment (n = 6–7 mice/group, mean ± SEM). **P < 0.01 (Mann-Whitney U test) between control and clodronate-treated mice. (G) The Pearson correlation between Tim-4+ TAM numbers and tumor load. Red line indicates regression fit.

