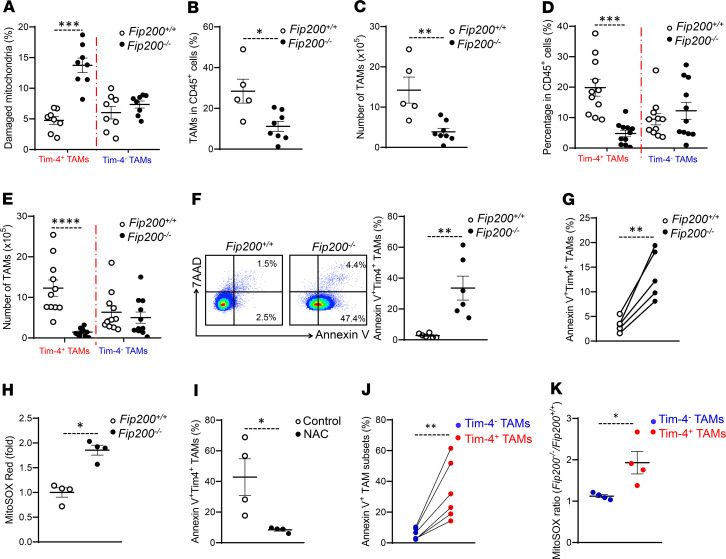
Figure 6. Autophagy deficiency results in loss of Tim-4+ TAMs in ovarian cancer.
(A) Effect of FIP200 deficiency on mitochondria in Tim-4+ TAMs and Tim-4– TAMs. The percentage of Tim-4+ TAMs and Tim-4– TAMs with damaged mitochondria in Fip200+/+ and Fip200–/– tumor-bearing mice. (n = 8 mice/group, mean ± SEM.) ***P < 0.001 (Mann-Whitney U test). (B and C) Percentage (B) and number (C) of TAMs in total immune cells between Fip200+/+ and Fip200–/– tumor-bearing mice (n = 5 to 8 mice/group, mean ± SEM). *P < 0.05, **P < 0.01 (Mann-Whitney U test). (D and E) Percentage (D) and number (E) of Tim-4+ and Tim-4– TAM subsets in total immune cells between Fip200+/+ and Fip200–/– tumor-bearing mice (n = 11 mice/group, mean ± SEM). ***P < 0.001, ****P < 0.0001 (Mann-Whitney U test) in Tim-4+ TAMs between Fip200+/+ and Fip200–/–. (F) Apoptosis of Tim-4+ TAMs in Fip200+/+ and Fip200–/– tumor-bearing mice. (n = 6 mice/group, mean ± SEM). **P < 0.01 (Mann-Whitney U test). (G) Effect of FIP200 deficiency on Tim-4+ TAM apoptosis. TAMs were analyzed for apoptosis 36 days after tumor inoculation (n = 5 mice/group). **P < 0.01 (Mann-Whitney U test). (H) Measurement of mitochondria-related ROS in Tim-4+ TAMs between Fip200+/+ and Fip200–/– tumor-bearing mice (n = 4 mice/group, mean ± SEM). *P < 0.05 (Mann-Whitney U test). (I) Effect of NAC on Tim-4+ TAM apoptosis in vivo (n = 4 mice/group, mean ± SEM). *P < 0.05 (Mann-Whitney U test). (J) Comparison of apoptosis between paired Tim-4+ and Tim-4– TAMs in Fip200–/– tumor-bearing mice (n = 6 mice/group). **P < 0.01 between Tim-4+ versus Tim-4– TAMs in Fip200–/– tumor-bearing mice (Mann-Whitney U test). (K) Mitochondrial ROS ratio of Fip200–/– versus Fip200+/+ in TAM subsets (n = 4 mice/group, mean ± SEM). *P < 0.05 (Mann-Whitney U test).

