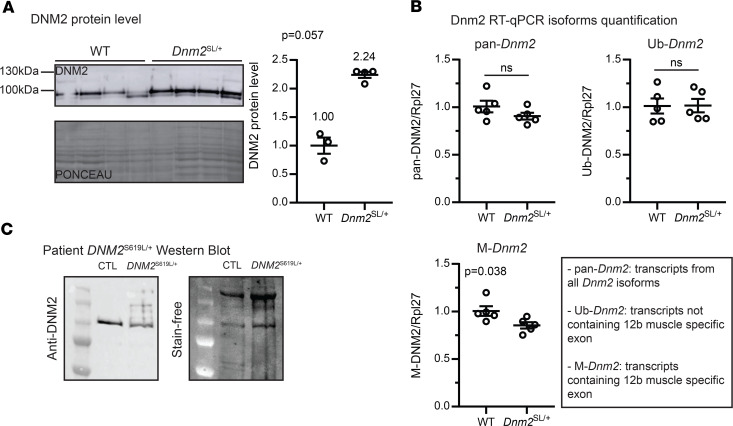
Figure 2. Dnm2SL/+ animals display an increased DNM2 level.
(A) DNM2 protein level in TA muscles of 8-week-old WT and Dnm2SL/+ (3 ≤ n ≤ 5; Mann-Whitney U test). (B) Dnm2 isoforms quantification. Pan-Dnm2 corresponds to all isoforms, Ub-Dnm2 to ubiquitous isoforms not including the muscle-specific exon 12b, M-Dnm2 to isoforms including the muscle-specific exon 12b (n = 5; unpaired t test). (C) Western blot of DNM2 in muscle from a patient with the DNM2 S619L mutation compared with control. ns, not significant comparing WT vs. Dnm2SL/+. Charts show individual points, with additional lines indicating mean ± SEM.

