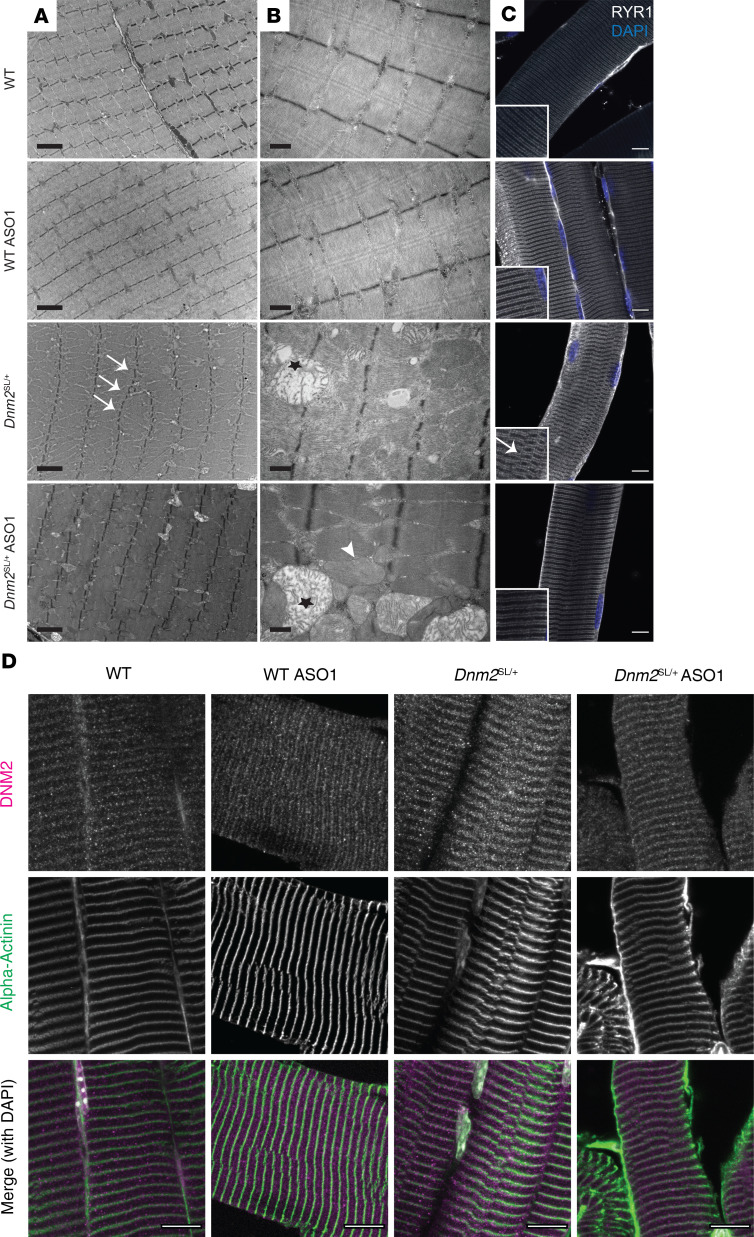
Figure 8. Ultrastructural analysis of Dnm2SL/+ muscles upon DNM2 reduction.
(A) Ultrastructural view by electron microscopy in TA muscles from 8-week-old WT and Dnm2SL/+ treated or not with ASO-1 antisense oligonucleotide targeting Dnm2 (n = 2). Arrows point to Z-line misalignment, and stars indicate swollen mitochondria. Scale bar: 2 μm. (B) Higher magnification on mitochondria showing 2 populations in the ASO-1 treated Dnm2SL/+ mice: swollen mitochondria with disrupted cristae (indicated by a star) and normal mitochondria (indicated by arrowhead). Scale bar: 0.5 μm. (C and D) Immunofluorescence in TA muscles from 8-week-old mice (n = 2) of RYR1 (ryanodine receptor, a marker of sarcoplasmic reticulum at the triad) and DAPI for nuclei (arrow points to misalignment) (C) and of DNM2 together with α-actinin (a marker of Z-line) and DAPI for nuclei (D). Scale bar: 10 μm.

