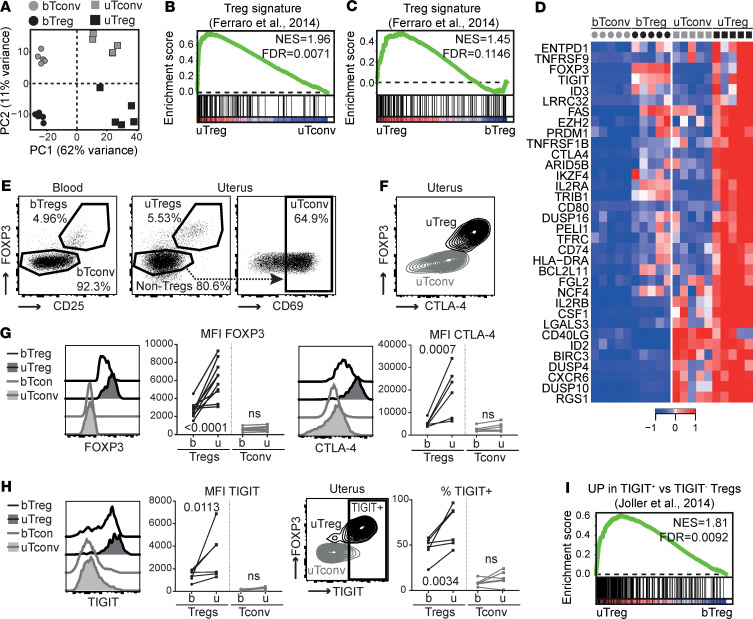
Figure 1. Tregs at the materno-fetal interface are bona fide Tregs.
(A) Principal component analysis of bTregs, bTconv, uTregs, and uTconv (all n = 5). (B and C) GSEA with published Treg signature gene set (71) comparing uTreg and uTconv (B) and uTreg and bTreg (C) (all n = 5). NES, normalized enrichment score; FDR, FDR adjusted P value. (D) Heatmap of genes in leading edge of GSEA comparing enrichment of published Treg signature genes in uTregs and bTregs. Expression values were mean centered and scaled per gene. (E) Representative gating strategy of bTregs, uTregs, and uTconv out of 5 experiments. (F) Representative expression of CTLA-4 in uTregs out of 6 experiments. (G) Ex vivo protein expression of core Treg molecules FOXP3 (n = 10) and CTLA4 (n = 6) measured by flow cytometry. (H) Ex vivo protein expression of Treg signature molecule TIGIT (n = 6) measured by flow cytometry. (G and H) Multiplicity adjusted P value of 2-way ANOVA with Tukey’s post hoc test. (I) GSEA of TIGIT+ Treg signature (n = 5) (72).

