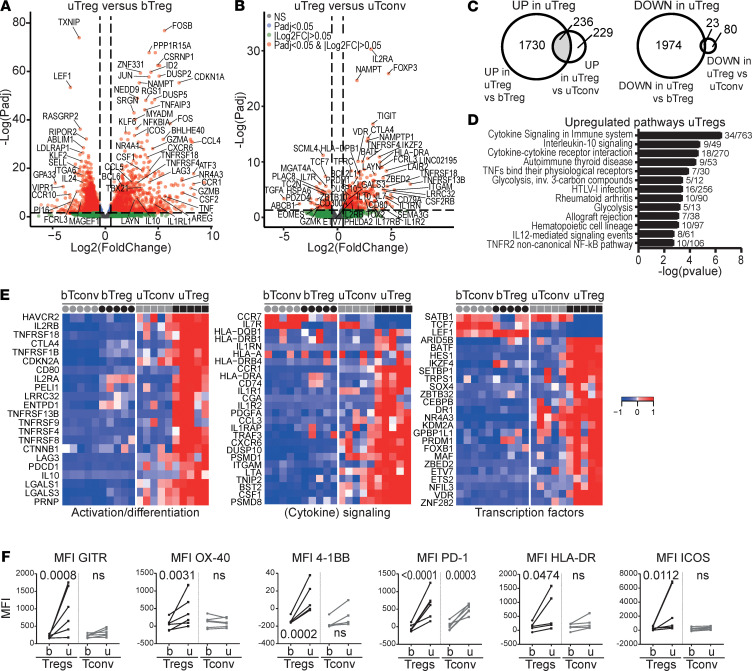
Figure 3. The uTreg core signature.
(A and B) Volcano plot of differential gene expression between uTregs and bTregs (A) or uTregs and uTconv (B) (all n = 5). (C) Venn diagrams yielding genes specifically upregulated (Padj < 0.05 and log2FC > 0.5, left panel) or downregulated (Padj < 0.05 and log2FC < –0.5, right panel) in uTreg compared with bTreg and uTconv. (D) Pathway analysis (ToppGene pathways) of 236 genes specifically upregulated in uTregs. P < 0.05 after Bonferroni’s correction were considered significant. (E) Heatmaps showing gene expression of genes in top 5 pathways and selected downregulated genes in the uTreg core signature, related to Treg activation or effector differentiation (left panel), (cytokine) signaling (middle panel; including downregulated CCR7 and IL7R), and transcription factors (right panel). Expression values were mean centered and scaled per gene. (F) Protein expression of GITR (TNFRSF18), OX-40 (TNFRSF4), 4-1BB (TNFRSF9), PD-1 (PDCD1), HLA-DR, and ICOS. uTregs were gated as CD3+CD4+CD25hiFOXP3+ cells. Multiplicity adjusted P value of 2-way ANOVA with Tukey’s post hoc test. n = 6 each.

