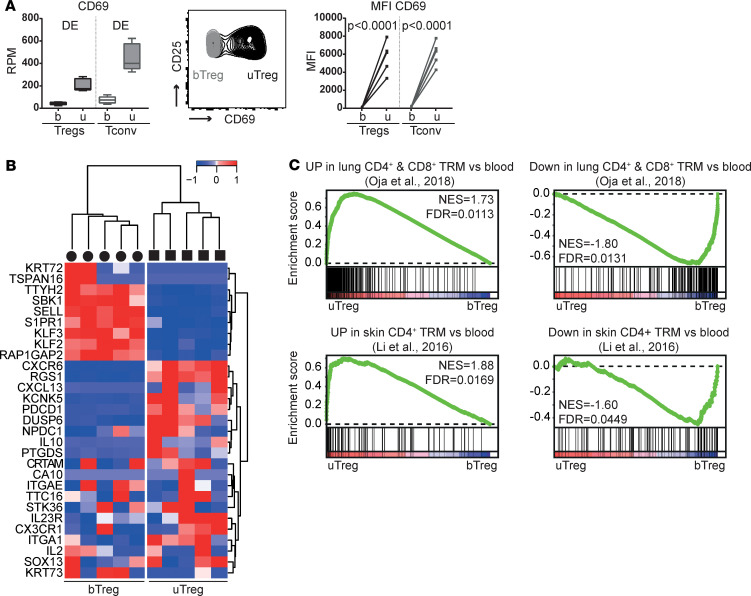
Figure 4. Tregs at the materno-fetal interface have a tissue-resident profile.
(A) Gene and protein expression of CD69 in sorted T cell populations. DE, differentially expressed genes with Padj < 0.05. Box plots with median: box indicates 25th to 75th percentiles, whiskers indicate minimum and maximum values (n = 5). FACS data: representative plot of 5 experiments. uTregs were gated as CD3+CD4+CD25hiCD127–. MFI, median fluorescence intensity. Two-way ANOVA with Tukey’s post hoc test. (B) Heatmap with a published human core tissue–resident signature (4) in uTreg compared with bTreg. Expression values were mean centered and scaled per gene. (C) GSEA with published genes identifying human lung CD4+ and CD8+ TRM compared with blood memory cells; ref. 86) and genes upregulated/downregulated in skin CD4+ TRM compared with blood CD4+ T cells (14), in uTregs versus bTregs. NES, normalized enrichment score; FDR, FDR adjusted P value.

