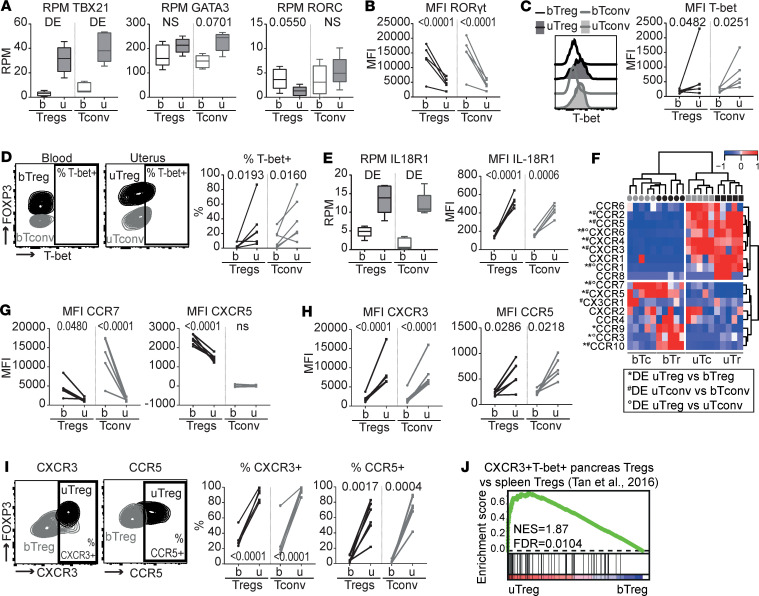
Figure 5. uTreg and uTconv polarization at the materno-fetal interface.
(A) Gene expression of lineage-defining transcription factors TBX21 (T-bet), GATA3 (GATA-3), and RORC (RORγt). P values from differential gene expression analysis. DE, differentially expressed Padj < 0.05. Box plots with median; box indicates 25th to 75th percentiles, and whiskers indicate minimum and maximum values (all n = 5). (B–D) Protein expression of RORγt (B) and T-bet (C and D). uTregs were gated as CD3+CD4+CD25hiFOXP3+ cells. MFI, median fluorescence intensity. Multiplicity adjusted P values of 2-way ANOVA with Tukey’s post hoc test.(n = 5) (E) Gene and protein expression of IL18R1 (IL-18R1). Gene expression: box plots with median — box indicates 25th to 75th percentiles, and whiskers indicate minimum and maximum values (n = 5). DE, differentially expressed Padj < 0.05. Protein expression: uTregs were gated as CD3+CD4+CD25hiFOXP3+ cells. Multiplicity adjusted P values of 2-way ANOVA with Tukey’s post hoc test (n = 5). (F) Heatmap showing gene expression of chemokine receptors. Expression values were mean centered and scaled per gene. DE, differentially expressed Padj < 0.05. (G–I) Protein expression of chemokine receptors downregulated (G) and upregulated (H and I) in uTregs. uTregs were gated as CD3+CD4+CD25hiFOXP3+ cells. P values of 2-way ANOVA with Tukey’s post hoc test (n = 5). (J) GSEA with published gene set of CXCR3+T-bet+ Tregs from the pancreas of prediabetic mice (38), comparing uTregs and bTregs. NES, normalized enrichment score; FDR, FDR adjusted P value.

