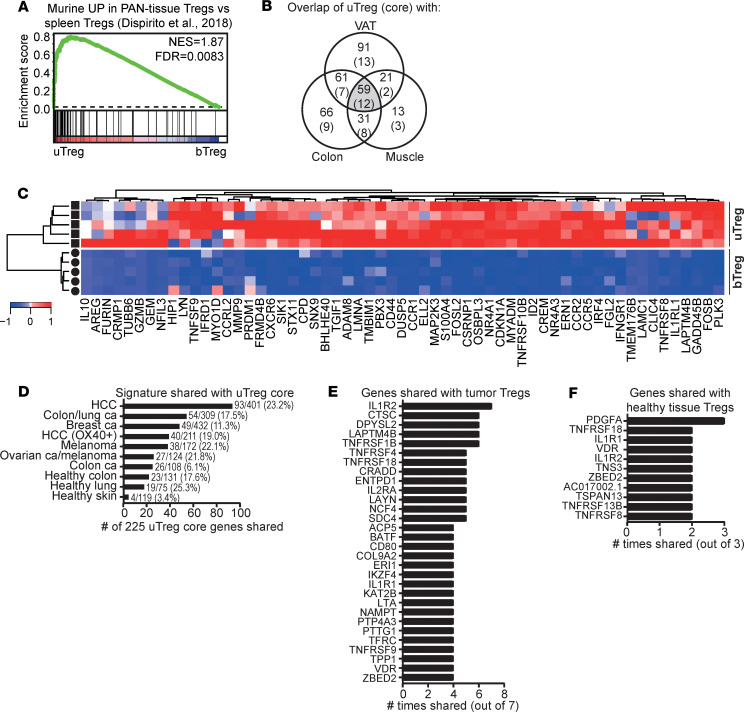
Figure 6. uTregs share their transcriptional signature with tissue- and tumor-infiltrating Tregs.
(A) GSEA with a published murine PAN-tissue gene signature (18), comparing uTregs and bTregs. NES, normalized enrichment score; FDR, FDR adjusted P value. (B) Venn diagram showing the numbers of genes upregulated in uTregs compared with bTregs (Padj < 0.05) (and genes in the uTreg core signature in parentheses), which are represented in tissue-specific and tissue-shared published murine gene signatures (18). VAT, visceral adipose tissue. (C) Heatmap showing the expression of the 59 genes that were part of the murine PAN-tissue signature and upregulated in uTregs compared with bTregs (Padj < 0.05) (18). Expression values were mean centered and scaled per gene. (D) The number of genes shared between the uTreg core signature and published human TITR signatures or healthy tissue Treg signatures (14, 17, 25, 95–100). Numbers behind bars indicate the number of shared genes out of the total number of genes in the specific signature. (E) The genes that were most often shared between the uTreg core signature and human TITR signatures (shared in ≥ 4 of 7 signatures). (F) The genes that were most often shared between the uTreg core signature and human healthy tissue Treg signatures (shared in ≥ 2 of 3 signatures).

