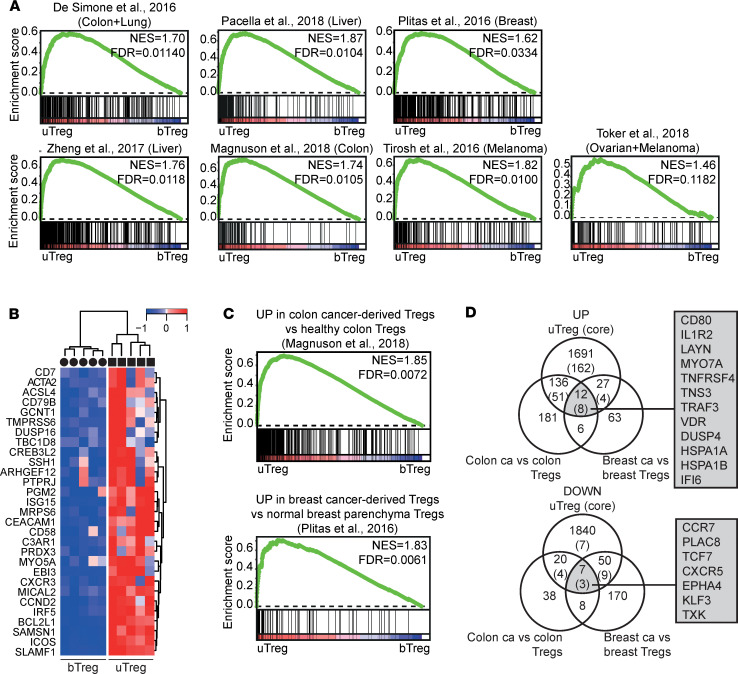
Figure 7. uTregs have a functional profile similar to tumor-infiltrating Tregs.
(A) GSEA with published TITR-specific signatures in uTregs versus bTregs (25, 95–100). NES, normalized enrichment score; FDR, FDR adjusted P value. (B) Heatmap showing expression of genes in the leading edge of ≥ 3 of 7 GSEA from Figure 7A, which were not represented in the uTreg core signature. Expression values were mean centered and scaled per gene. (C) GSEA with published gene signatures specific to Tregs from tumor tissue compared with the healthy tissue counterpart in uTregs versus bTregs(26, 100). NES, normalized enrichment score; FDR, FDR adjusted P value. (D) Venn diagrams showing shared genes between uTregs and genes specifically upregulated in Tregs from tumor tissue compared with the healthy tissue counterpart (26, 100).

