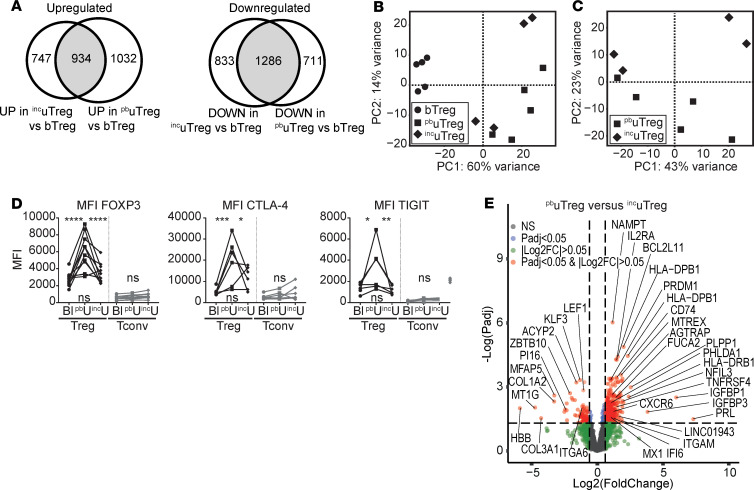
Figure 8. uTregs show site-specific adaptation to the materno-fetal interface.
(A) Venn diagrams of genes upregulated (left panel) and downregulated (right panel) in both incuTregs and pbuTregs compared with bTregs. (B) PCA of bTregs (n = 5), pbuTregs (n = 5), and incuTregs (n = 4). (C) PCA of pbuTregs (n = 5) and incuTregs (n = 4). (D) Protein expression of FOXP3, CTLA-4, and TIGIT. uTregs were gated as CD3+CD4+CD25hiFOXP3+ cells. Multiplicity adjusted P value of 2-way ANOVA with Tukey’s post hoc test. Left upper P value, blood versus placental bed; right upper P value, placental bed versus incision site; lower P value, blood versus incision site. MFI, median fluorescence intensity. (E) Volcano plot of differentially expressed genes between pbuTregs and incuTregs. ****P < 0.0001, ***P < 0.001, **P < 0.01, *P < 0.05.

