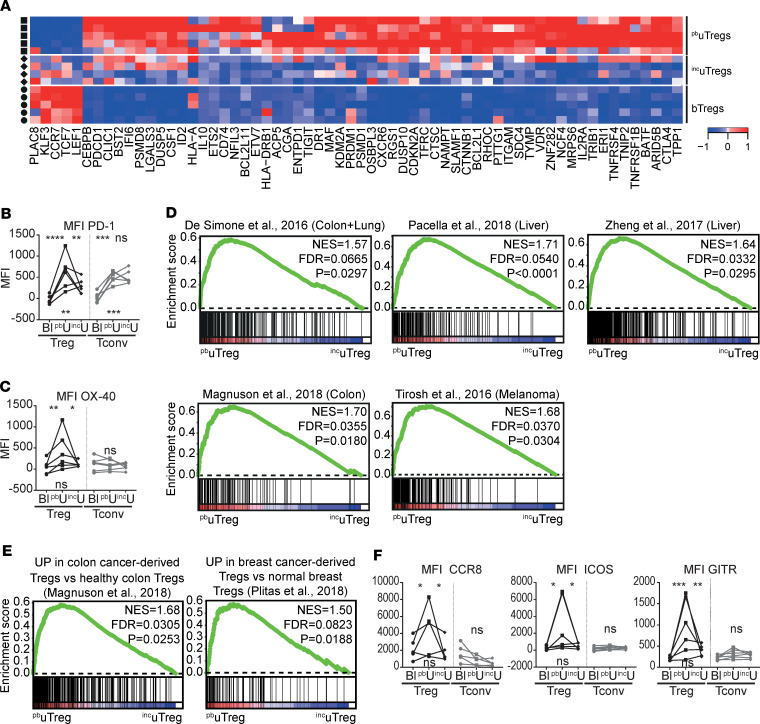
Figure 9. uTregs show site-specific adaptation to the materno-fetal interface.
(A) Heatmap with previously highlighted genes in this manuscript that were differentially expressed between pbuTregs and incuTregs. Expression values were mean centered and scaled per gene. (B and C) Protein expression of PD-1 (B) and OX-40 (C). uTregs were gated as CD3+CD4+CD25hiFOXP3+ cells. Multiplicity adjusted P value of 2-way ANOVA with Tukey’s post hoc test. Left upper P value, blood versus placental bed; right upper P value, placental bed versus incision site; lower P value, blood versus incision site. MFI, median fluorescence intensity (n = 6). (D) GSEA with published TITR-specific signatures in pbuTregs versus incuTregs (25, 95–100). NES, normalized enrichment score; FDR, FDR adjusted P value. (E) GSEA with published gene signatures specific to Tregs from tumor tissue compared with the healthy tissue counterpart in pbuTregs versus incuTregs (26, 100). (F) Protein expression of CCR8 (n = 5), ICOS (n = 6), and GITR (n = 6). uTregs were gated as CD3+CD4+CD25hiFOXP3+ cells. Multiplicity adjusted P value of 2-way ANOVA with Tukey’s post hoc test for protein. Left upper P value, blood versus placental bed; right upper P value, placental bed versus incision site; lower P value, blood versus incision site. MFI, median fluorescence intensity. ****P < 0.0001, ***P < 0.001, **P < 0.01, *P < 0.05.

