Figure 4.

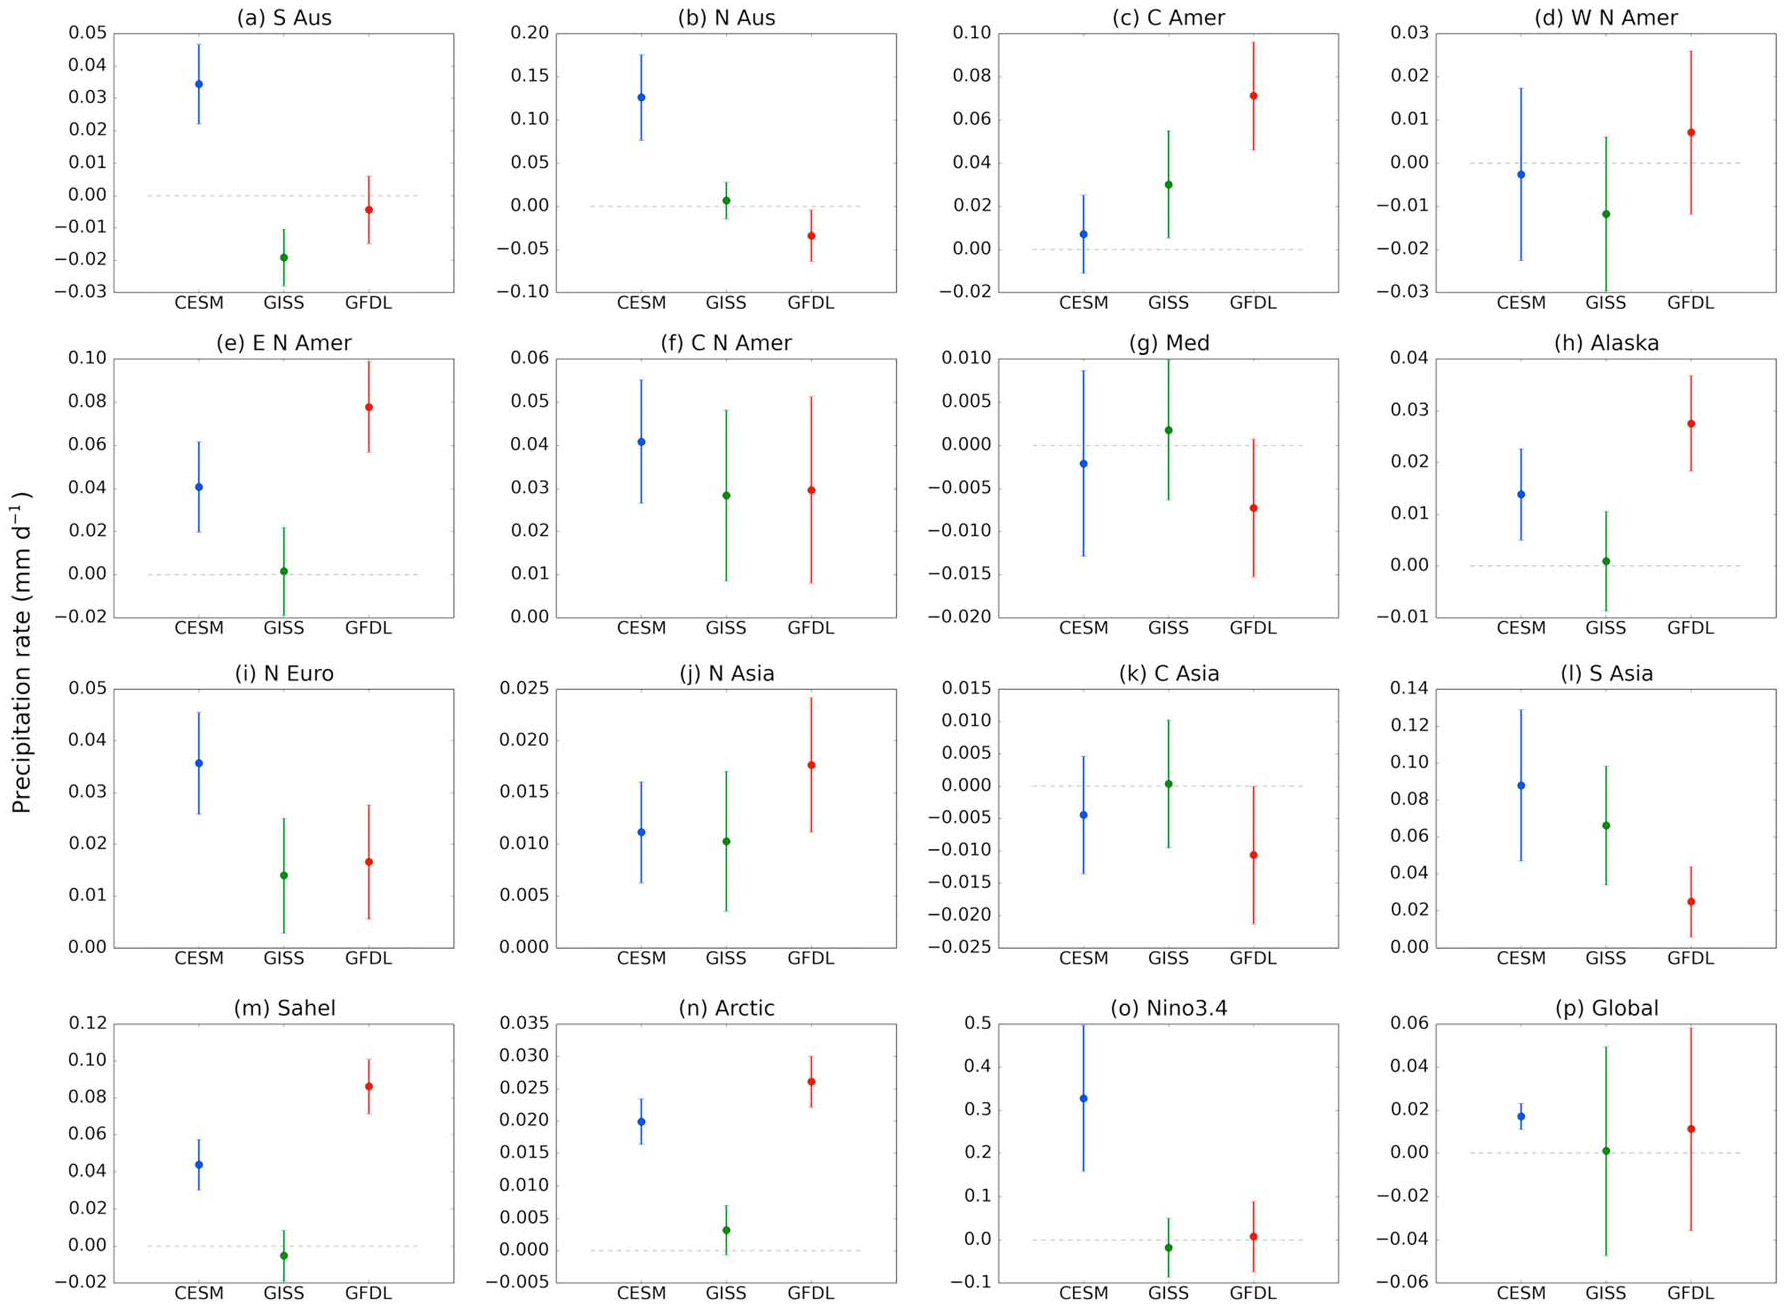
Mean (dots) and standard error (bars) of precipitation response to zero U.S. sulfate in each of the three models in 15 regions and globally. See Table S1 for region definitions.

Mean (dots) and standard error (bars) of precipitation response to zero U.S. sulfate in each of the three models in 15 regions and globally. See Table S1 for region definitions.