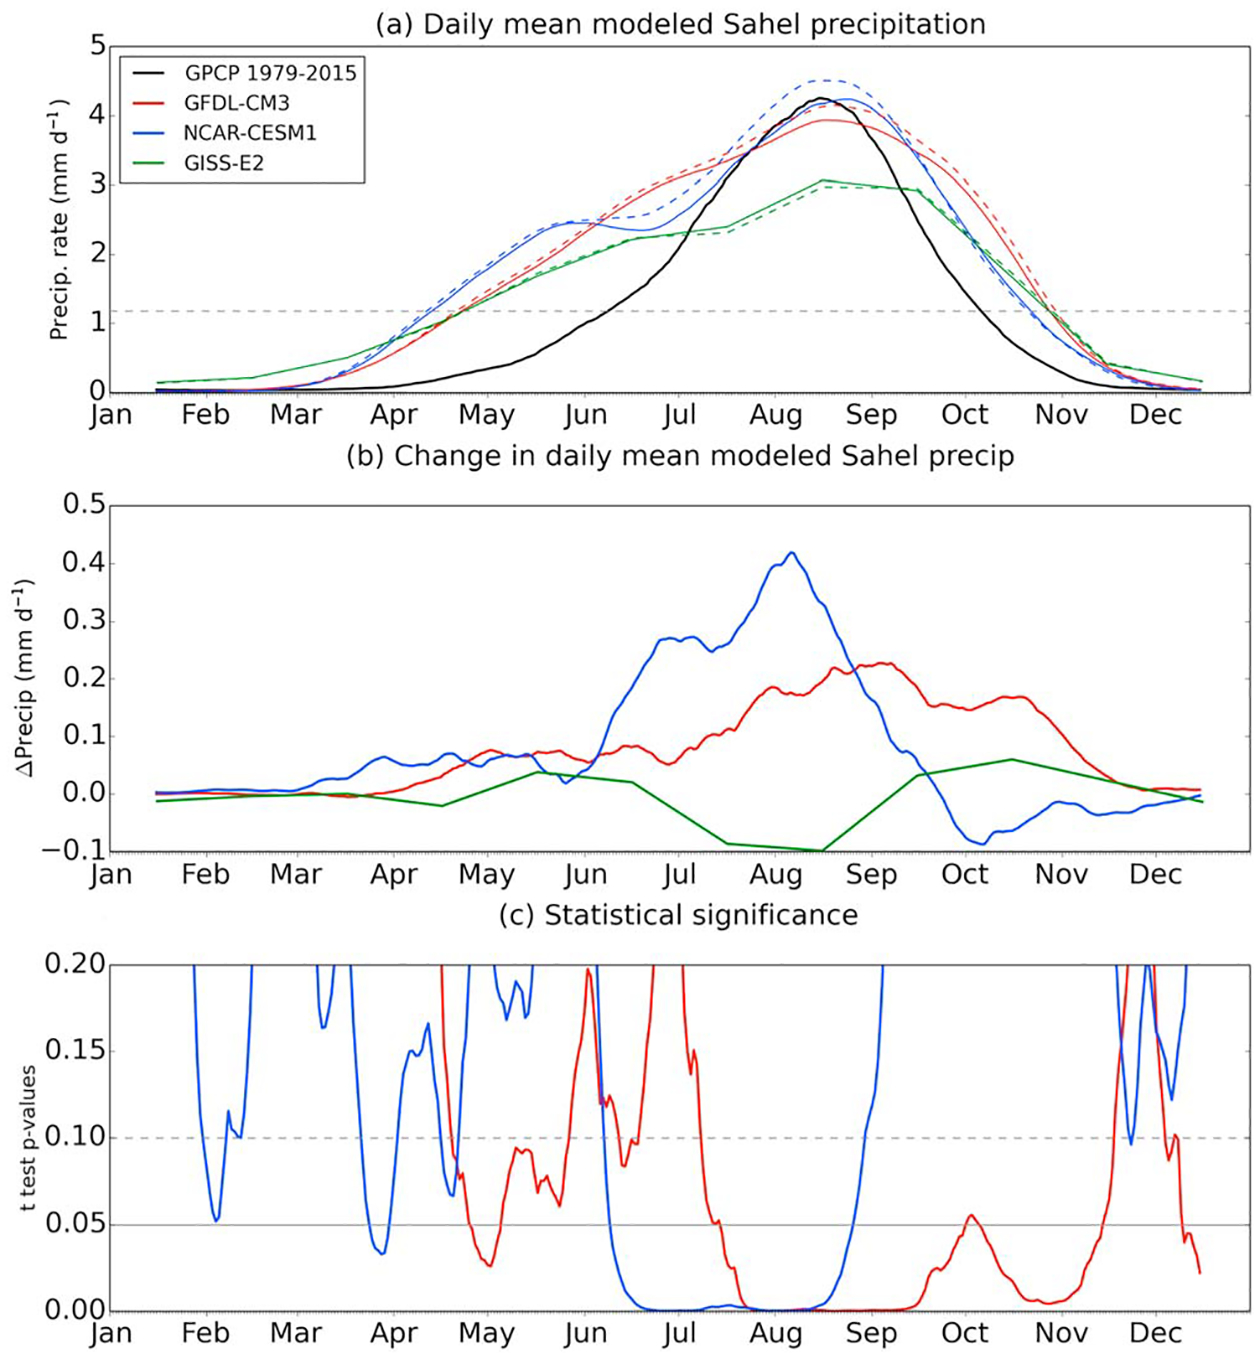
Figure 5.

(a) 31 day running mean daily Sahel precipitation in the control run (solid lines) and perturbation run (dashed lines) in each model. GPCP observations are shown in solid black. The dashed line represents GPCP annual mean. (b) Difference between perturbation and control runs in daily Sahel rainfall. (c) Daily P values from a Student’s t test on Sahel rainfall. Daily data were not available for GISS-E2, so monthly means are plotted in Figure 5. Sahel region defined as 20°W to 40°E, 10°N to 20°N.
