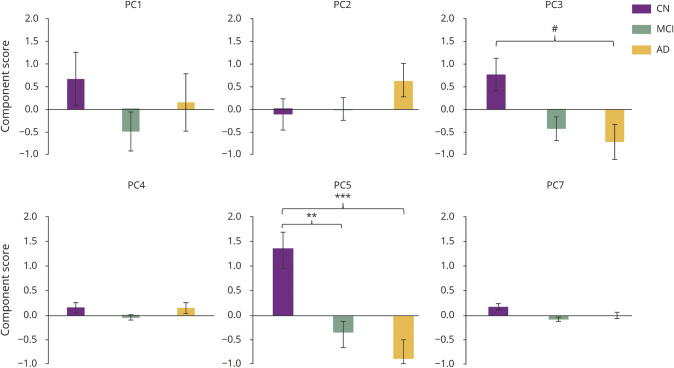
Figure 1. Group differences of PCs of TGs with diagnosis groups (CN, MCI, and AD).
A series of 6 separate generalized linear models were performed to assess diagnostic group (cognitively normal [CN], mild cognitive impairment [MCI], Alzheimer disease [AD]) differences across all principal components (PCs). Bonferroni adjustment was used to correct for significance of diagnostic group differences across the 9 PCs of triglycerides (TGs). Covariates included age, sex, body mass index, total TGs, and APOE ε4 status. Values are mean ± standard error. #p = 0.0533, *p < 0.05, **p < 0.01, ***p < 0.001.

