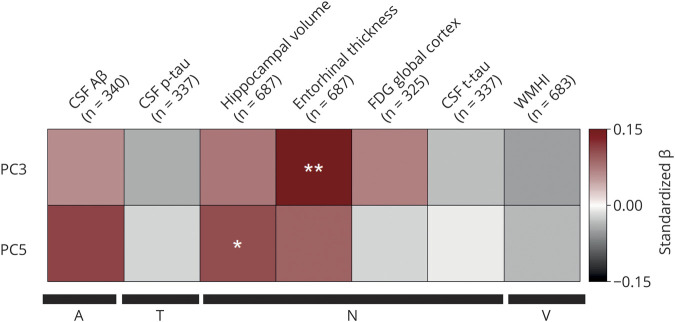
Figure 2. Association of TG PC3 and PC5 with A/T/N/V biomarkers for Alzheimer disease.
A series of 14 separate post hoc linear regressions were performed to assess the association of 7 amyloid, tau, neurodegeneration, and cerebrovascular disease (A/T/N/V) biomarkers with principal component (PC) 3 and PC5. Bonferroni adjustment was used to correct for the 14 association analyses between PC3, PC5, and 7 A/T/N/V endophenotypes. Covariates included age, sex, body mass index, total triglycerides (TGs), and APOE ε4 status for all A/T/N/V phenotypes. For MRI biomarkers, we also included years of education and intracranial volume as additional covariates. The y-axis colors represent standardized β values from the linear regression analysis, with shades of red indicating a positive standardized β value and gray scale indicating a negative standardized β value. Aβ = β-amyloid1-42 peptide; FDG global cortex = cortical glucose standardized uptake value ratio measured from [18F]fluorodeoxyglucose-PET scans; p-tau = tau phosphorylated at threonine 181; t-tau = total tau; WMHI = white matter hyperintensity total volume. *p < 0.05, **p < 0.01.

