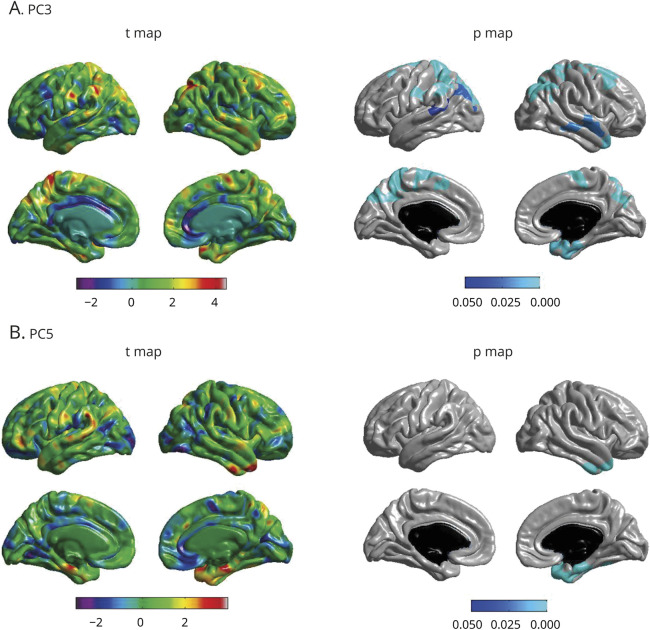
Figure 3. Whole-brain surface-based analysis of cortical thickness for PC3 and PC5.
(A) Whole-brain analysis of cortical thickness across the brain surface was performed to identify the association of 2 principal components (PCs) ([A] PC3 and [B] PC5) with brain structure shown as a t value map and a p value map. Statistical maps were thresholded using a random field theory for a multiple testing adjustment to a significance level of 0.05. Positive t values (red, yellow) indicate thicker cortical thickness. The p value for clusters indicates significant p values with the lightest blue color. Covariates included age, sex, body mass index, total triglycerides, APOE ε4 status, years of education, and intracranial volume.

