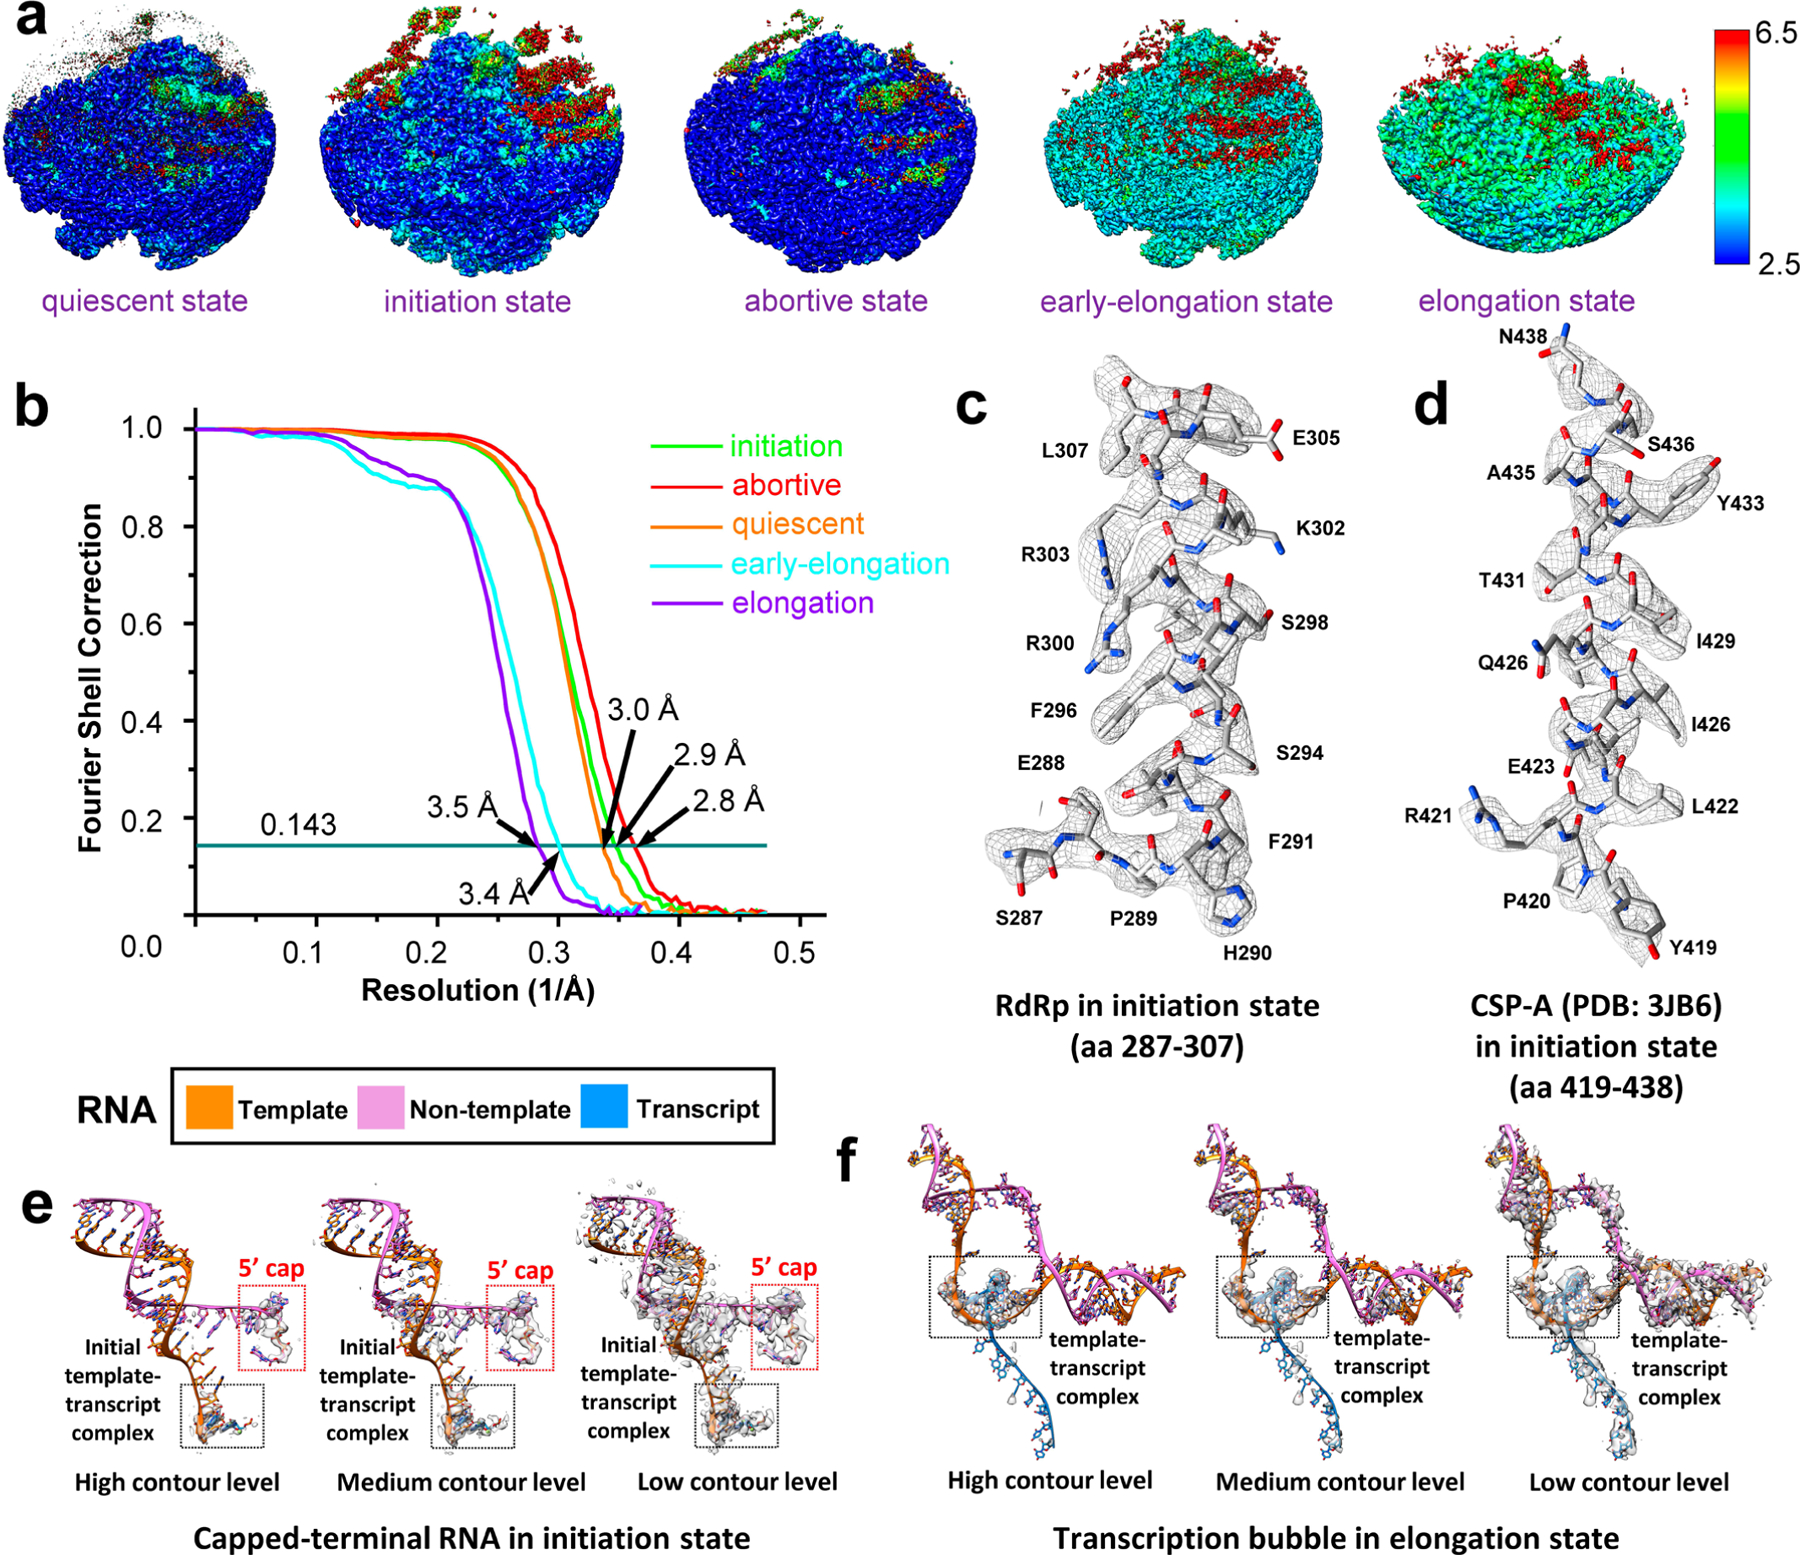
Extended Data Fig. 3 |. Resolution verification.

a,b, Local (a) and Fourier shell correction (FSC) (b) resolution evaluation for the structures representing the five states. c,d, Density map (mesh) and atomic model (sticks) of a helix in RdRp (c) and in CSP-A (d), showing side chain densities of similar quality. e,f, RNA density map (semi-transparent grey) and atomic model (mainchains in ribbons and bases in sticks) of the capped-terminal RNA in the initiation state (e) and of the transcription bubble in the elongation state (f).
