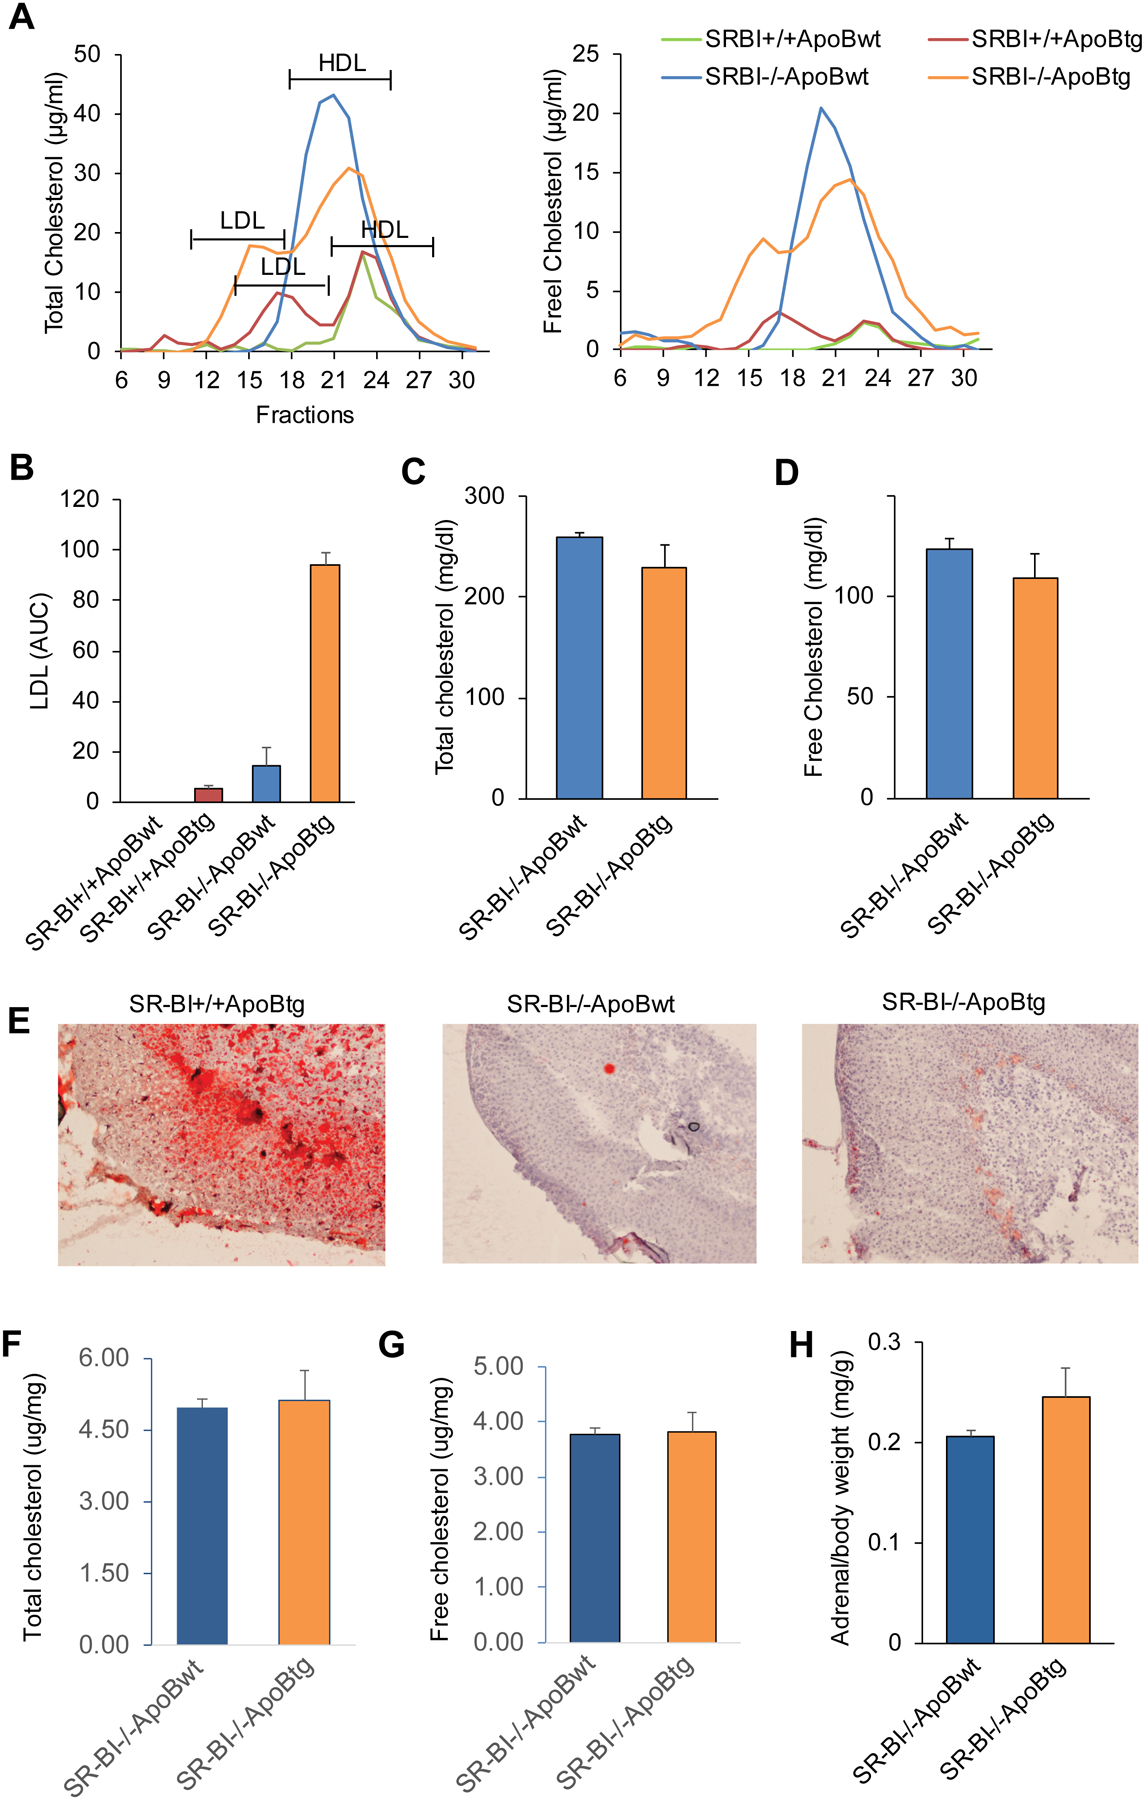
Figure 1. SR-BI−/−ApoBtg mice display a human-like lipoprotein profile.

(A) Plasma from SR-BI−/−ApoBwt or SR-BI−/−ApoBtg mice was fractionated with FPLC and the lipoprotein profiles were analyzed by measuring total cholesterol and free cholesterol, respectively in each fraction. n = 2 per group (all females); (B) Area under curve (AUC) of LDL, n = 2 per group; (C and D) The total cholesterol and free cholesterol concentrations in plasma, n = 4–5 per group (all females). (E) The Oil Red O staining of adrenal gland, n=3 per group (all males), representative data; (F and G) Quantification of total and free cholesterol contents in adrenal gland (μg/mg tissue), n=2–3 per group (all males); (H) adrenal weight (mg/g body weight), n= 3 per group (all males). Data represent the mean ± SEM.
