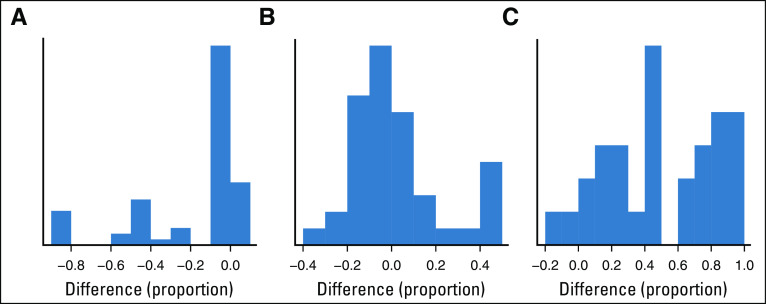
FIG 1.
Comparison of the design with subgroup-specific safety monitoring and optimal dose selection with a design that ignores subgroups. Histograms of differences between empirical proportions of Pr(stop|subgroup, dose) – Pr(stop|dose) are given for (A) truly safe doses, (B) truly unsafe doses, and (C) Pr(select|subgroup, dose) – Pr(select|dose) differences showing the probabilities of correctly selecting truly optimal doses.

